Among news on growing Covid-19 threat and lock downs we forgot about an early outbreak on Diamond Princess cruiser ship. The case gives us opportunity to learn how Covid-19 develops in human population and measure its impact in terms of infection and mortality rate . I found Diamond Princess case a couple of days ago, while preparing data for this post. Then it made to top 20 countries by number of detected Covid-19 cases. I was looking at this group and a strange country coded JPG11668 attracted my attention, it turned out to be Diamond Princess cruise ship. As of 26th March ECDC data JPG11668 does not qualify to top 20, it ranks 39. I would have missed it if only it was positioned like that a couple of days ago. Sometimes a pure luck reveals an important piece of information. This one allows to estimate Covid-19 target infection rate at 20% and mortality at 0.2% of total population affected.
Table below displays countries and regions sorted according to cumulative Covid-19 cases detected. China remains a leader, Italy is the second. Judging from recent progress US is likely to overtake China soon. Italy is a sad leader in fatalities, growing to more than double Chinese figure. Diamond Princess (JPG11668) is easily dwarfed by above numbers.
| GeoId | Countries and territories | CumCases | CumDeaths | CasesMortality% | |
|---|---|---|---|---|---|
| 0 | CN | China | 81968 | 3293 | 4.02 |
| 1 | IT | Italy | 74386 | 7505 | 10.09 |
| 2 | US | United_States_of_America | 69194 | 1050 | 1.52 |
| 3 | ES | Spain | 47610 | 3434 | 7.21 |
| 4 | DE | Germany | 36508 | 198 | 0.54 |
| 5 | IR | Iran | 27017 | 2077 | 7.69 |
| 6 | FR | France | 25233 | 1331 | 5.27 |
| 7 | CH | Switzerland | 9714 | 103 | 1.06 |
| 8 | UK | United_Kingdom | 9529 | 422 | 4.43 |
| 9 | KR | South_Korea | 9241 | 131 | 1.42 |
| 39 | JPG11668 | Cases_on_an_international_conveyance_Japan | 705 | 7 | 0.99 |
Covid-19 on Diamond Princess
I found information on Diamond Princess on National Institute of Infectious Diseases (NIID) page. The source is close to subject since she is mooring in Yokohama Japan. As of 5 February, there was a total of 3711 individuals on board the Diamond Princess, with 2666 passengers and 1045 crew members. Actual number of death cases is 7.
Chart below shows Covid-19 cumulative cases evolution and mortality among detected cases. Diamond Princess population was thoroughly tested, with almost 100% of passengers and crew covered. We can assume all Covid-19 cases were detected.
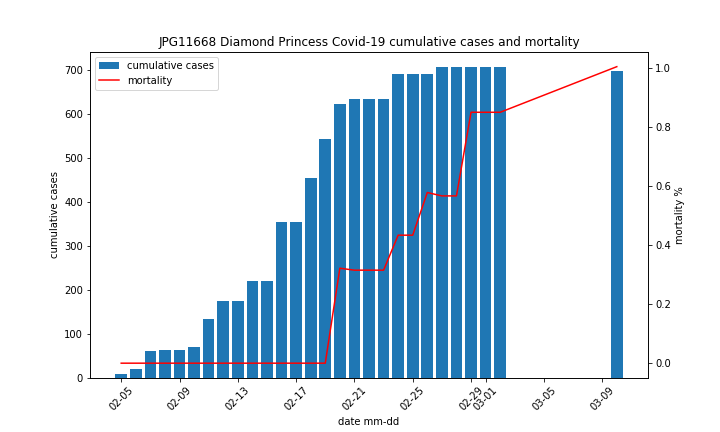
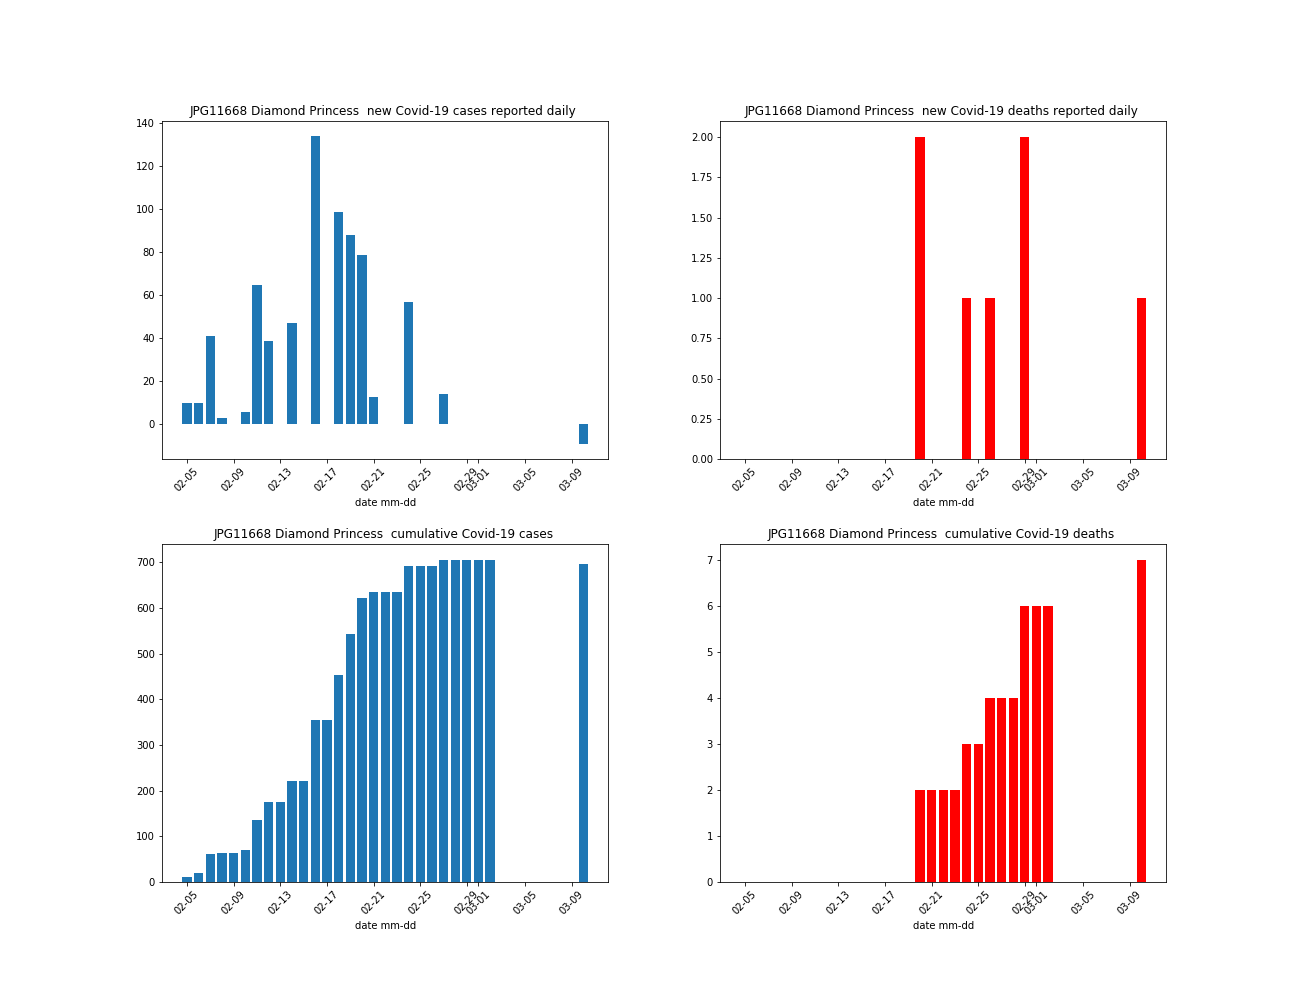
Chart below shows detected cases and mortality data, bot per day and cumulative figures. Gaps on cumulative data are due to gaps in ECDC data set. Most probably reporting was discontinued once disembarkation completed on Feb 28th. However on 03-10 there was another death case reported making a total of 7. This day data shows a negative (-9) number of cases. The latter figure is bit unusual, since ECDC showed only new cases as positive number. Perhaps it reflected some data correction e.g. previously reported cases were false positives. Lack of recovered cases reporting is one of ECDC data improvement areas.
Quarantine efficiency
Let’s have a look at timing data:
- 2020-02-05 first case reported
- 2020-03-10 last case reported
- 2020-02-16 peak cases reported per day
- 34 days between first and last case
- 11 days between first case and peak
Covid-19 spread was quick, start to peak in just 11 days. Cruising ship is a confined space pretty crowded comparing to on shore standards. Diamond Princess was not build with passenger isolation in mind and it was hard to convert her into mass isolation facility. Quarantine was called for cases on board, but how effective was it? In my opinion everyone on Diamond Princess had contact with Covid-19 virus and chance to contract it. Faster disembarkment would slow down/limit the virus spread at expense of greater on shore transfer risk. It is an old custom to prevent ship with disease outbreak to enter port (yellow flag).
Around 20% of population as infected 80% was not. I would attribute this split to natural resilience to Covid-19 in 80% of ship population, who were exposed to the virus but did not contract illness. Cruise ship crew and passengers can be considered a random sample drawn from population. There is a good chance Diamond Princess case models Covid-19 outbreak in any population.
Population impact
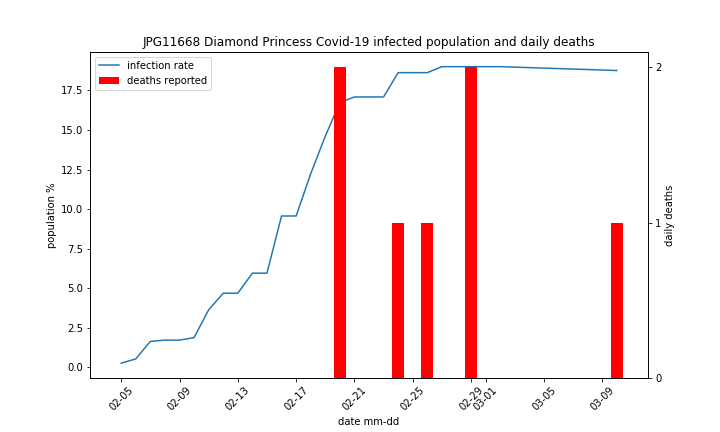
Chart below shows Diamond Princess population share infected by Covid-19. We divide number of detected cases by total ship population (3711). Infection share peaks around 20% (19% technically speaking,). Slight drop at the right end side results form negative new cases number reported 10.03 discussed above. Red bars show death cases (7), they distribute more or less evenly over time. For time series counting 7 samples it is hard to discuss curve shape. We can calculate mortality rate for population: 7/3711 gives around 0.2%
Diamond Princess infected population and mortality summary is the following:
- Population 3711, infected 696, dead 7
- 20% infection rate for population (696 out of 3711)
- Infection rate reached plateau after 20 days
- 0.2% mortality rate for population (7 out of 3711)
- 1% mortality rate for infected cases (7 out of 696)
Diamond Princess Covid-19 test penetration was almost 100%
Diamond Princess projection to countries
Projecting Diamond Princess data to counties is challenging since we are comparing fully developed disease with developing one. Countries differ widely by detected cases mortality rate. Table below in last column shows ratio of country mortality to the German one. There is a factor of 20 difference between Italy and Germany! In my opinion the only explanation is data sample distortion.
| Country | Cases | Deaths | Cases Mortality % | Mortality / Mortality DE | |
|---|---|---|---|---|---|
| 1 | Italy | 74386 | 7505 | 10.09 | 18.7 |
| 4 | Germany | 36508 | 198 | 0.54 | 1.0 |
| 11 | Austria | 5888 | 34 | 0.58 | 1.1 |
| 15 | Norway | 2916 | 12 | 0.41 | 0.8 |
| 39 | Diamond Princess | 705 | 7 | 0.99 | 1.8 |
Country sample distortion mechanism
ECDC data set does not include number of tests performed in each country. I found some information Germany executed broad testing covering at least 250 thousands samples. While Italy was focusing on testing cases showing symptoms. Let’s suppose testing is a bottleneck, then the following picture will develop:
- Tests are available population is tested, positive cases emerge
- Initial fatalities are detected, mortality for detected cases is low
- Disease develops, more cases are detected, tests are running low, priority is given to cases with symptoms
- Cases with symptoms testing makes detected cases loaded with heavier ones
- Mortality rate in detected cases grows rapidly
- Growing number of cases creates positive feedback loop, mortality rate for detected cases soars
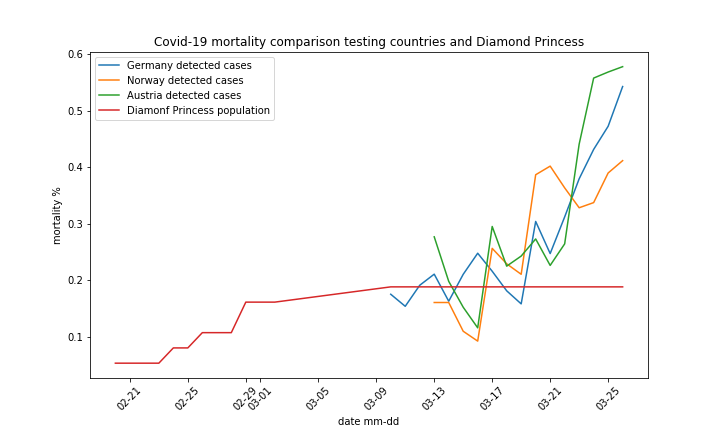
Recommendations for potential Covid-19 patients in Italy confirm above mechanism may be indeed in place. Stay at home if not experiencing serious problems eliminates light and moderate cases from sample, tests are run by hospitals. Picture below also supports our hypothesis. We see even for countries with high initial testing cases mortality starts to go up. Cases mortality for Diamond Princess stopped at 1%, it is not shown on chart (y scale limit), instead we show mortality for entire population. It topped at 0.2% with 20% of total population affected as discussed above.
Hope from numbers
Let’s assume in countries Covid-19 final stage will look like Diamond Princess. Penetration will reach 20% and mortality 0.2% population. Cases mortality will be 1%. We can then estimate actual cases figure from death count by simply dividing it by 1% (0.01). Results are in table below:
| Country | Cases | Deaths | Population | Estimated Cases | Estimated Penetration % |
|---|---|---|---|---|---|
| Italy | 74386 | 7505 | 60480 | 750500 | 1.24 |
| Germany | 36508 | 198 | 82790 | 19800 | 0.02 |
| Austria | 5888 | 34 | 8822 | 3400 | 0.04 |
| Norway | 2916 | 12 | 5368 | 1200 | 0.02 |
Please note: This section has been edited on 2020-04-02. Original version used 0.2% cases mortality, figure representing initial mortality for cases in Germany. Diamond Princess cases mortality was 1%. Of course recalculated estimate values are 5 times lower than original ones. There is a chance Diamond Princess case mortality can be revised down, but it requires a separate discussion.
Population data are in thousands. Cases and deaths are cumulative. Italy has a huge gap between detected cases and estimated ones. The later is close to a million. For Germany, Austria and Norway number of detected cases is higher than Diamond Princess figure. This may be related to either lower mortality rate, or time lag between epidemic start and fatalities build up. For Germany detected cases mortality fluctuated around 0.2% between 10 and 20 March and a considerable buildup of detected cases took place in that period. It makes me to believe German cases mortality rate may be around 0.2% not 1% like Diamond Princess.
Action needed
Run Covid-19 tests to verify actual penetration in Italy population. If discrepancy on cases is as huge as estimated (74 thousands detected vs. 750 thousands actual) it will be immediately confirmed by a simple statistical poll over representative sample drawn from population. If estimated penetration figure is confirmed current lock down measures have to be reconsidered.