Covid-19 is taking a death toll, but is it significant from population perspective? We crunch some ECDC data released 5th of April, to measure how severe is Covid-19 impact so far on human population. We use this opportunity to refine Covidmeter concept introduced in previous post.
High and low case mortality countries
Data for chart below are selected in the following way:
- Top20 selected from all countries sorted by cumulative number of Covid-19 cases
- Top20 sorted by case mortality rate (cumulative deaths / cumulative cases)
- High5 and Low5 mortality rate countries selected from the above list top & bottom
Cases mortality rate for county is plotted once cumulative deaths exceed 20 threshold.
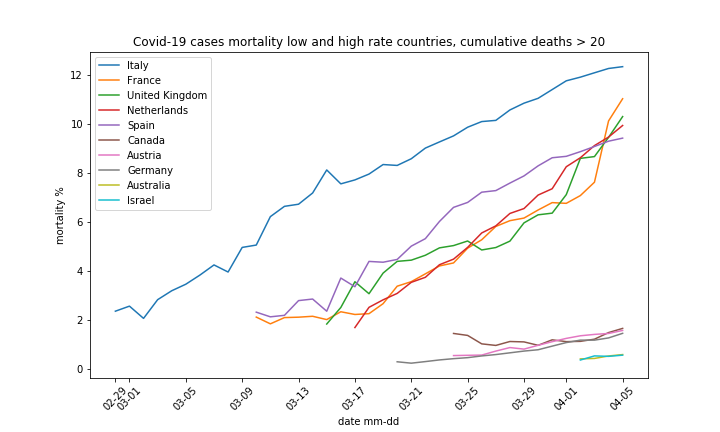
As we can see all Low5 countries are now visible. Israel and Australia are around 0.5%. Development for the former will be interesting to observe since there were rumors they have amassed huge stockpile of tests resorting even to Mosad secret operations. If Israel deploys wide testing then according to our theories cases mortality rate should stay low. Anyway question remains why number of Covid-19 tests performed in a country is not available?
On the High5 side we see a jump in France cases mortality rate making it number 2 in this batch. Italy mortality is still growing and reached 12.3%. Please note mortality growth for Italy seems to slow down. We present some additional plots for Italy below.
Country in focus – Italy
Daily deaths and mortality rate evolution
We have decided to show recent data only for better visibility. Data are selected in the following way:
- deaths (daily) are shown from date when cumulative death count exceeds 2% of current cumulative deaths. Currently there are 28 days on plot, we plan to limit number of bars to 40. Again this approach allows for better visibility of recent changes
- deaths 7d MA is seven day moving average for daily deaths. Moving average shows average for last 7 days for each date
- cases mortality is (cumulative deaths) / (cumulative cases), shown on right y axis in % points
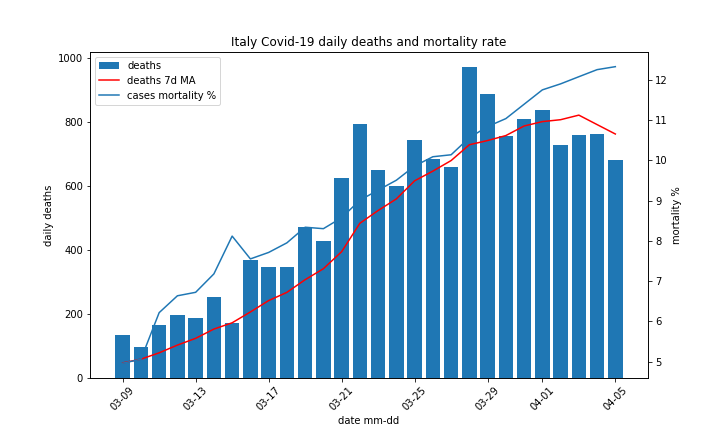
We can see MA for daily deaths is dropping. This is a very positive sign, suggesting a peak of epidemic ma have been reached. Figure above suggests it has happened at the end of March. Please remember ECDC data set we are using does not include recovered cases. Daily deaths depend on number of active cases (detected – dead – recovered).
Reported cases and estimated actual cases
Data for chart below are selected in the following way:
- detected cases (left y axis) are cumulative sum of daily reported cases. It represent total number of cases change over time
- actual cases estimate (right y axis) is derived from cumulative number of deaths and population mortality rate 0.2% calculated for Diamond Princess Covid-19 outbreak, details here.

Again a huge gap between reported cases and estimated actual number can be verified with statistical population testing. If estimated number if cases is true Covid-19 is much less dangerous than feared.
Covidmeter – population impact
We calculate population impact using population mortality rate per 1000 people. Population mortality allows to measure how dangerous is epidemic for population as a whole. Data on chart bellow are calculated in the following way:
- Select all countries where number of cumulative deaths exceeds threshold of 100
- Sort selected countries by population mortality (popmort) rate defined as:
population mortality = (cumulative deaths) / (country population) * 1000 - Select 5 countries from top of list above,
- Plot population mortality data for selected countries over last 10 days

While looking at picture above please remember the following numbers:
- Diamond Princess population mortality was 2
- Number of deaths per year for European countries is around 10
Population impact table
Table below show mortality data for countries with more than 100 cumulative deaths. There are 25 such countries in 2020-04-05 ECDC data set. First column (DRANK) shows country ranking in cumulative number of deaths, it starts at 0 (highest rank). Table rows are sorted by population mortality rate. Please note upper part of table is occupied by European countries. This may be related to the population age profile.
China once the leader is now number 6 in cumulative deaths ranking. There are 6 countries with more cumulative deaths (0 to 5), try to locate them in the table. There is a prize here: Better perspective on Covid-19 epidemic.
| DRank | Country | pop2018 | CumCases | CumDeaths | CasesMortality | PopMort |
|---|---|---|---|---|---|---|
| 0 | Italy | 60431283 | 124632 | 15362 | 12.33 | 0.25 |
| 1 | Spain | 46723749 | 124736 | 11744 | 9.42 | 0.25 |
| 3 | France | 66987244 | 68605 | 7560 | 11.02 | 0.11 |
| 9 | Belgium | 11422068 | 18431 | 1283 | 6.96 | 0.11 |
| 7 | Netherlands | 17231017 | 16627 | 1651 | 9.93 | 0.10 |
| 10 | Switzerland | 8516543 | 20489 | 666 | 3.25 | 0.08 |
| 4 | United Kingdom | 66488991 | 41903 | 4313 | 10.29 | 0.06 |
| 5 | Iran | 81800269 | 55743 | 3452 | 6.19 | 0.04 |
| 13 | Sweden | 10183175 | 6443 | 373 | 5.79 | 0.04 |
| 23 | Ireland | 4853506 | 4604 | 137 | 2.98 | 0.03 |
| 20 | Denmark | 5797446 | 4077 | 161 | 3.95 | 0.03 |
| 2 | United States of America | 327167434 | 312237 | 8501 | 2.72 | 0.03 |
| 14 | Portugal | 10281762 | 10524 | 266 | 2.53 | 0.03 |
| 17 | Austria | 8847037 | 11766 | 186 | 1.58 | 0.02 |
| 8 | Germany | 82927922 | 91714 | 1342 | 1.46 | 0.02 |
| 19 | Ecuador | 17084357 | 3465 | 172 | 4.96 | 0.01 |
| 22 | Romania | 19473936 | 3613 | 141 | 3.90 | 0.01 |
| 15 | Canada | 37058856 | 13882 | 231 | 1.66 | 0.01 |
| 11 | Turkey | 82319724 | 23934 | 501 | 2.09 | 0.01 |
| 18 | South Korea | 51635256 | 10237 | 183 | 1.79 | 0.00 |
| 24 | Algeria | 42228429 | 1300 | 130 | 10.00 | 0.00 |
| 6 | China | 1392730000 | 82575 | 3333 | 4.04 | 0.00 |
| 12 | Brazil | 209469333 | 10278 | 432 | 4.20 | 0.00 |
| 21 | Philippines | 106651922 | 3094 | 144 | 4.65 | 0.00 |
| 16 | Indonesia | 267663435 | 2092 | 191 | 9.13 | 0.00 |
Covidmeter – Diamond Princess comparison
Chart below shows population impact chart discussed above with Diamond Princess population mortality rate (2 per 1000) added for reference. As we can see there is a big gap between current numbers and reference figure. I don’t expect it to be fully filled.
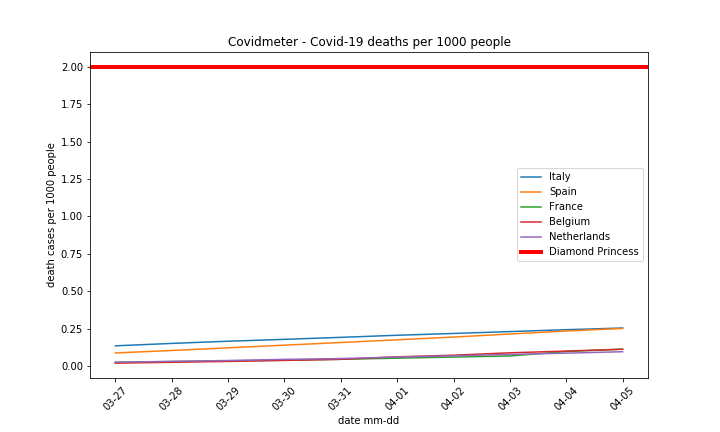
Current Covid-19 population mortality is far from numbers are not compatible with global disaster narration widespread in social media. Of course observing hygiene standards and keeping social distancing will not hurt. Country wide lock downs and following economic impact on the other hand for sure will. Please remember daily death count in Italy started to drop and stay calm.