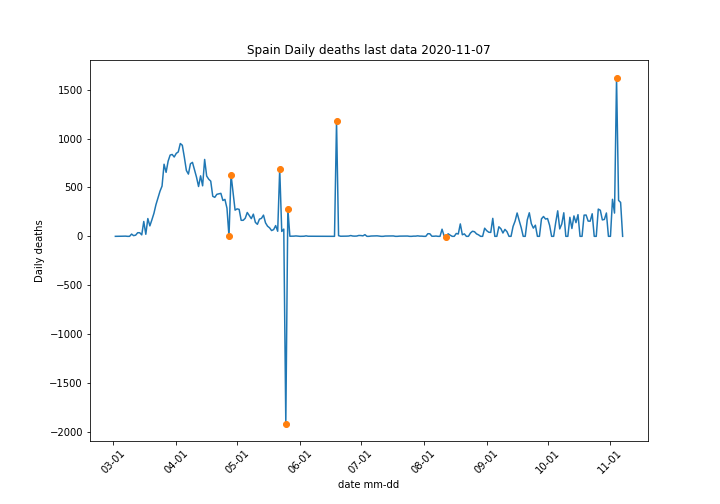
ECDC data set for Spain shows some strange patterns, on 2 days daily death count is negative. One figure recorded 25th May is huge -1918, the other form 12th Aug is just -2 but still it should not be negative. I understand there may be situations where data need correction, but in data set presenting time series it should be done by correcting data at date when it was previously overstated. Otherwise entire data collection process becomes doubtful. Figure below shows daily deaths data for Spain with potentially wrong entries marked by orange dots.

Table below lists data points which need to be corrected:
| index | DateRep | GeoId | Cases | Deaths | Countries and territories | |
|---|---|---|---|---|---|---|
| 1 | 46429 | 2020-04-27 | ES | 1660 | 0 | Spain |
| 2 | 46428 | 2020-04-28 | ES | 1525 | 632 | Spain |
| 3 | 46404 | 2020-05-22 | ES | 1787 | 688 | Spain |
| 4 | 46401 | 2020-05-25 | ES | -372 | -1918 | Spain |
| 5 | 46400 | 2020-05-26 | ES | 859 | 283 | Spain |
| 6 | 46376 | 2020-06-19 | ES | 307 | 1179 | Spain |
| 7 | 46322 | 2020-08-12 | ES | 3172 | -2 | Spain |
| 8 | 46238 | 2020-11-04 | ES | 25042 | 1623 | Spain |
- Items 1,2 – Deaths from 2 days were probably recorded under one date
- Item 3 unusually high figure comparing to nearby points
- Item 4 negative deaths count (-1918)
- Items 5, 6 unusually high figure comparing to nearby points
- Item 7 negative death count (-2)
- Item 8 surge in death counts, can be attributed to 2nd wave impact, but for me it look as data glitch since it stands out nearby points
Conclusions
Items 3 to 7 from above table combined (688-1918+283+1179-2) total 230. Recording this figure on 26th May and zeroing existing entries can be a quick fix to the data, but the case requires a deeper investigation how Spanish data are reported. It is especially important if we take into account deaths surge reported Nov 4th. It looks like a data collection glitch, but it may as well represent valid data resulting from 2nd wave, so it definitely need investigation.
Added 2020-11-13:
It seems Spain has own understanding of time series. November spike comes from re-stating definition of Covid-19 deaths. Why do they post +1300 deaths occurred prior to 11th May together with current data (297 deaths on 2020-11-04) in November is hard to comprehend. Such an approach clearly distorts 2nd wave statistics. https://www.aa.com.tr/en/europe/spain-s-covid-19-death-toll-surges-by-1-623/2032447