Category Archives: Covid-19

Covidmeter 2020-12-14

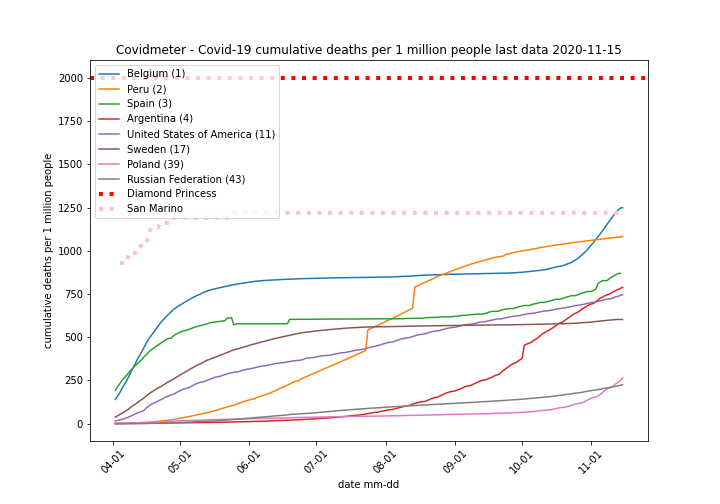
Covid-19 2nd wave finally hit San Marino, a long serving estimate of cumulative deaths ceiling. First death of 2nd wave in San Marino occurred 2020-11-19 there were 9 fatalities since, last one reported 13th Dec. For reference 1st wave death toll at San Marino was 42, Douglas Adams fans should recognize importance of this number. ECDC data set issued 14th Dec is the final daily update, from now on they switch to weekly reporting. I liked this source of data despite of its flaws, since it integrated many country sources. I have no idea why they have decided to change established reporting schedule. Updated Covidmeter chart below.

  1. North Macedonia made 4th place and death count is growing quite rapidly. The country has area similar to Belgium and around 2 millions inhabitants.
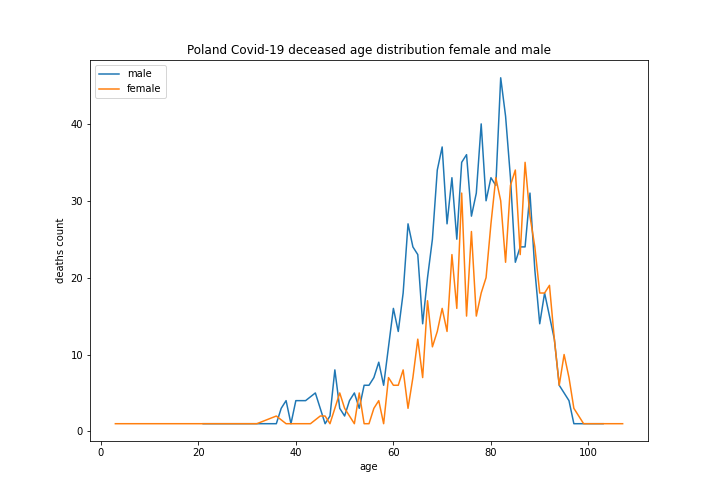
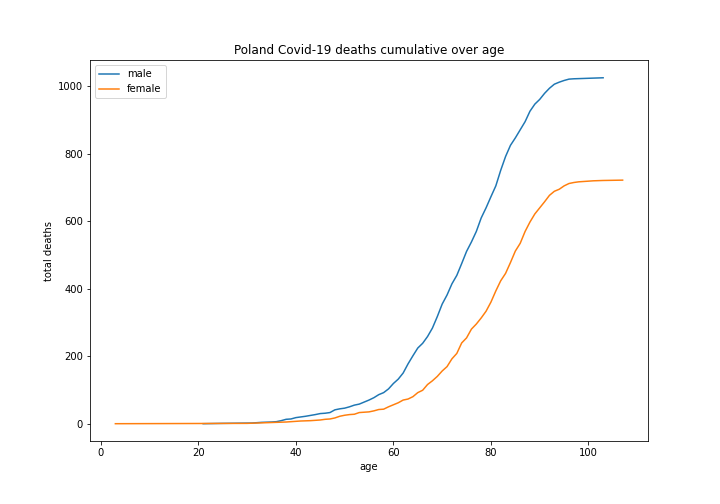
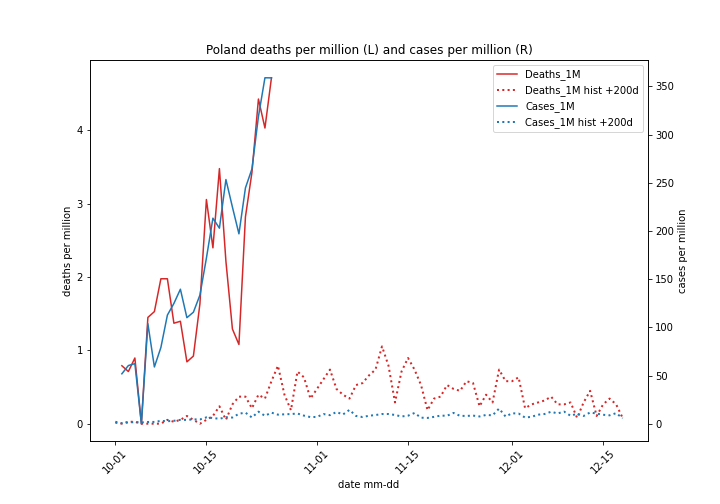
  2. Poland dashed past Russia and is chasing Sweden, let’s hope it will fail in this particular race.
  3. Russia has adopted Sweden like approach before 2nd wave, there is no lock down, however government advertises high hygiene standards and social distancing. So far this policy is paying off.
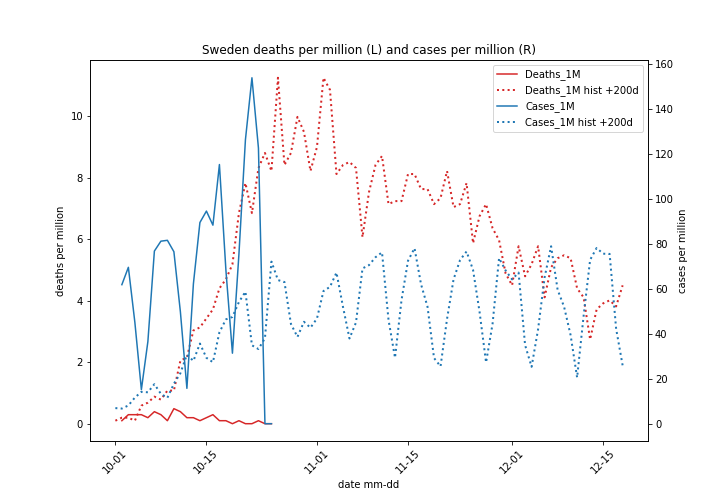
  4. Sweden approach works, there are casualties but countries with chaotic lock down policies take higher toll. Of course no lock down makes a nice target for political opposition – you gamble with people lives. However past experience shows the gamble was worth taking. Swedish government is free to use this argument for its defense.

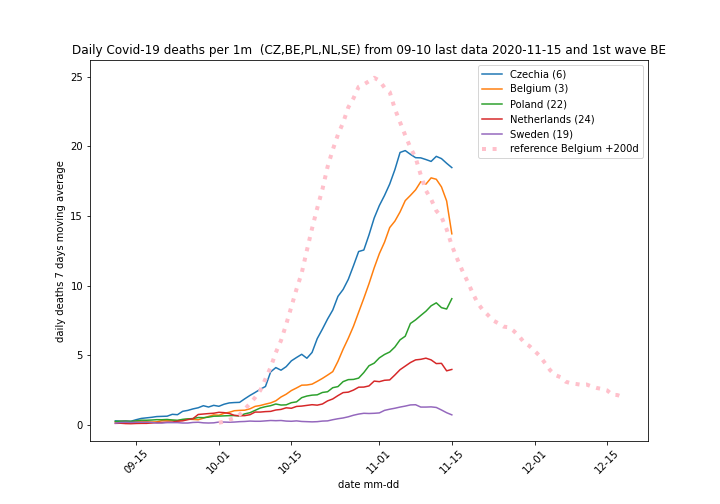
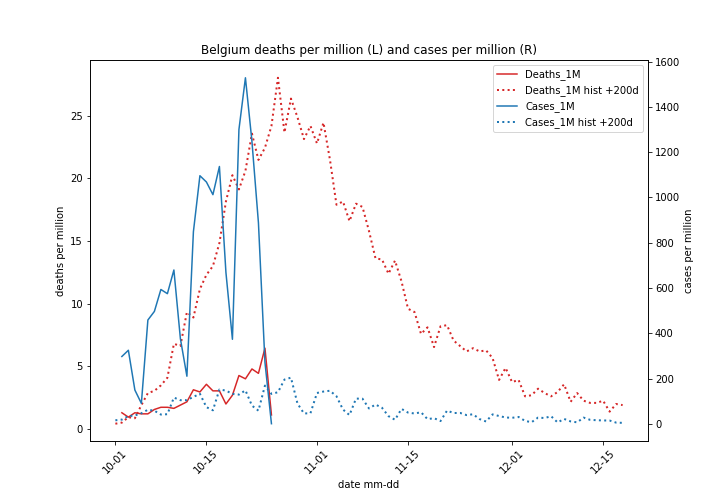
Figure below compares Covid-19 1st wave in Belgium (200 days ago, dotted line) with current figures. As we can see no country made past 1st wave Belgium peak and 2 wave peak seems to have passed.

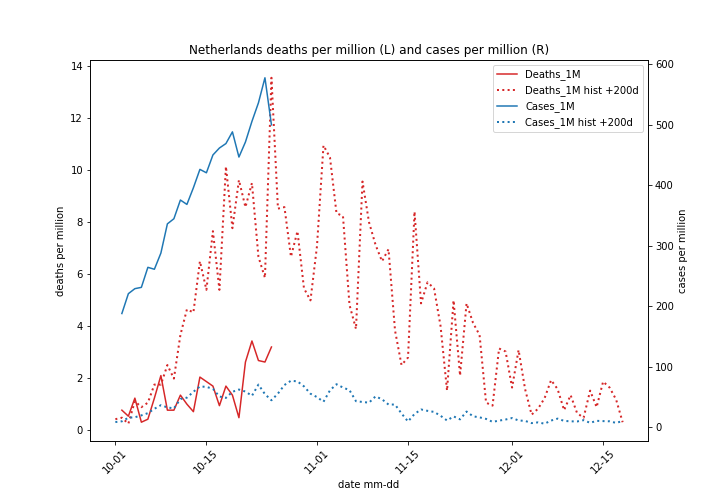
Netherlands (red line) compared to Belgium (green) had much lower death rate than nearby Belgium. They had lighter lock down policy, as BBC claims face masks were mandated only on 1st of Dec 2020, official policy here. I am not sure if face masks are mandatory outdoors, I was amused masks are not required “while swimming in a swimming pool”. This regulation indicates swimming pools are still open. Dutch experience shows face mask does no magic, however there is a pressure to enforce one so other governments don’t look stupid. In general there is a lack of analysis of what really works and why “compensated” with abundance of pressure to implement restrictions for the sake of public good.

Covid-19 status in Europe and ranking confusions

I it is very tempting to state country X leads in Covid-19 deaths or detected cases since it makes a flashy headline. However for the sake of understanding the situation, one should realize over which period was the ranking calculated and how significant is the difference between leader and others.

Chart below shows estimated number of Covid-19 ill in selected European countries. I believe true ranking should be build over entire pandemic duration (March 2020 till now, 23.11) using maximum value in this period. This ranking is shown on cart legend after country name. Countries are sorted top down according to latest reading to make country line location easier. Poland is 2nd in group on the day of reading, but only 12 in overall ranking. Poland 10 thousands ill per million is less than 50% of Belgium maximum (22 thousands per million). Belgium passed the peak and is trending down. Poland may have reached the peak, but we need to wait a couple of days to confirm downtrend. Tomorrow we may see Poland with highest number of ill in the group, yet its figure will be lower than today, just Switzerland figure was dropping faster.

Chart below shows daily deaths 7 days moving average for same country group as above. Averaging eliminates some data noise, countries like Belgium tend to provide preliminary data, they are revised (up) later. Averaging eliminates wild swings between last reading and previous ones. If tomorrow news flashes Poland has most deaths don’t let it deceive you. Currently Czechia, Poland, Belgium, Italy, Switzerland and France have very similar Covid-19 death count.

Conclusions

  1. Don’t focus on single number, look at time evolution and compare with other data.
  2. If somebody tries to convince you situation ins bad in particular country have a look at numbers and compare it with others.
  3. Sweden has neither compulsory mask nor lock down, yet it is doing quite well in above statistics. Some people don’t like Swedish approach and the are quite vocal. If you see another lament on desperate situation in Sweden recall the data and try to guess why the author tries to convince you Sweden is in serious trouble.

Covidmeter 2020-11-15

Belgium finally passed San Marino mark in cumulative deaths per million inhabitants. Belgium deaths are higher than other countries. Please keep in mind around 1.2% or 12000 per million people in any developed country with expected life span of 85 years pass away on annual basis. Covid-19 outbreak lasts around 8 months. During that period 9000 (8/12 * 12000) people per million died in Belgium, 1250 had Covid-19 diagnosed. In other words 14% of death count had Covid-19.

Daily deaths 7 day moving average is now trending down in Belgium and Netherlands. It will probably go down in Czechia as well. On chart below dotted line represents Belgium daily deaths from 1st Covid wave moved forward on time axis by 200 days, we plot it for reference. Solid lines are current data.

Covid-19 cumulative cases and cases mortality evolution

Cumulative Covid-19 cases are growing over time as long as epidemic is active, so does cumulative death count. Cases mortality defined as cumulative deaths to cumulative cases quotient varies over time. In this post we show how it evolved.

Chart below shows top 10 countries by cumulative Covid-19 cases per million inhabitants. It also shows Diamond Princess (cruise ship hit by Covid-19 at the beginning of pandemic) cumulative cases for reference.

Cumulative cases ranking

Top 10 countries by cumulative cases per million inhabitants are displayed on chart below, data are the same as above, but removed reference line changes y-axis range. We see leaders in ranking come form Persian Gulf area, they are closely followed by European countries. US (8) has the most cases in absolute numbers. Please note China – the source of problem is not there. They have either managed to eliminate Covid-19 or understood real risk relate to it and quenched media hype around it. I think the latter is true.

Mortality evolution

Chart below shows how Covid-19 mortality changed over time. Country list is top 10 by cumulative cases discussed above. Country rank in cases mortality is displayed next to its name. We see leaders of cumulative cases ranking Bahrain, Qatar have very low mortality. This may be due to climate, genetic difference, or just better overall quality of health service including widespread testing from epidemic onset. Please note for Belgium, Spain and US mortality rate dropped with growing number of cumulative cases. The easiest explanation is growth of testing capacity resulting in better detection.

Table below shows country details, Countries are sorted by cases mortality value at latest data point (end of curve). Please note difference between Spain with current (cumulative) cases mortality at 2.8% and Qatar 0.17% is over 10 fold. For comparison Diamond Princess cases mortality was around 1%.

CountryCases Mortality %Cumulative CasesCumulative Deaths
1Spain2.82143722040461
2Belgium2.6752029713891
3United States of America2.3010554801242430
4Panama1.971433522830
5Armenia1.481143831697
6Czechia1.294466755755
7Israel0.843221592706
8Kuwait0.62134932830
9Bahrain0.3984192332
10Qatar0.17135132234

Conclusions

  1. Cases mortality goes down with number of cases detected. This shows high mortality readings are related to poor testing.
  2. Seasonal flue mortality according US CDC is around 0.15%. This is compatible with Covid-19 mortality in Qatar, while US figure is much higher 2.3%. Covid-19 toll may be inflated if all deceased with active Covid and other diseases are attributed to the former. Such an approach is initially prudent, but leads to impact overestimation.
  3. Taking into account impact of Covid on economy and society quality and quantity of data available is far from satisfactory. Those who have relevant data (China?) handle situation much better with more confidence.

Belgium Covid-19 active cases drop

Belgium Covod-19 active cases start to drop. Recent data for this country may be subject to correction, but downtrend is clearly visible. Similar effect may be in Czechia. Please refer to previous posts for explanation how active cases are calculated. Number in brackets after country name is all time rank in active Covid-19 cases count. Countries on chart are sorted top down according to most recent reading.

Please note Poland is now below 50% of Belgium peak value. I’ don’t expect Poland figure to much higher, we likely to see peak forming around current levels.

How many active Covid-19 cases are there?

Multiple sources quote number of Covid-19 daily cases, but information on actual count of patients active at any given moment is rare. ECDC data set I use does not show number of recovered patients, so it is not possible to subtract cumulative recoveries form cumulative cases to calculate number of ill people at any given moment. However we still can estimate number of Covid-19 infected using number of cases.

Estimation method

Whoever contracts Covid1-19 will either recover or die after some time. Let us make the following simple assumption regarding actual illness duration:

  1. Covid-19 patient is ill 14 days from infection date inclusive
  2. Then 7 day recovery period starts and number of infected patients drops linearly

Above rule will give us a set ow weights (see figure below) to be applied to daily cases in order to calculate current number of Covid-19 patients (cases).

Estimation results

Figure below shows estimated number of active Covid-19 cases for selected countries. Only countries above 1 million population were taken into account. Next to country name, in brackets, country all time rank in number of active Covid-19 cases is shown. In order to compare countries with different populations number of Covid-19 ill people (cases) per million is plotted.

  1. Belgium holds all time top in Covid-19 active cases. Czechia is number 2, its curve (in this scale) is similar to Belgium one, we don;t show it to avoid chart overcrowding.
  2. Israel and Qatar had high readings but they have dropped significantly. Israeli drop may be due to lock down imposed on country. I have no details on Qatar lock down policy.
  3. Sweden 2nd wave is much lower than Belgium and other countries, please note Sweden 1st wave was extended over time and the country had distinct lock down policy.
  4. Belgium number of active cases may have peaked, but since Belgium data are delayed (it takes 3 days before all cases are counted) we need to wait a bit in order to confirm this conclusion.
  5. What is happening now in Europe is very similar to Qatar experience, they have survived it so we will too. Unless health services are better organized there…

Strange data form Spain

ECDC data set for Spain shows some strange patterns, on 2 days daily death count is negative. One figure recorded 25th May is huge -1918, the other form 12th Aug is just -2 but still it should not be negative. I understand there may be situations where data need correction, but in data set presenting time series it should be done by correcting data at date when it was previously overstated. Otherwise entire data collection process becomes doubtful. Figure below shows daily deaths data for Spain with potentially wrong entries marked by orange dots.

Table below lists data points which need to be corrected:

indexDateRepGeoIdCasesDeathsCountries and territories
1464292020-04-27ES16600Spain
2464282020-04-28ES1525632Spain
3464042020-05-22ES1787688Spain
4464012020-05-25ES-372-1918Spain
5464002020-05-26ES859283Spain
6463762020-06-19ES3071179Spain
7463222020-08-12ES3172-2Spain
8462382020-11-04ES250421623Spain
  1. Items 1,2 – Deaths from 2 days were probably recorded under one date
  2. Item 3 unusually high figure comparing to nearby points
  3. Item 4 negative deaths count (-1918)
  4. Items 5, 6 unusually high figure comparing to nearby points
  5. Item 7 negative death count (-2)
  6. Item 8 surge in death counts, can be attributed to 2nd wave impact, but for me it look as data glitch since it stands out nearby points

Conclusions

Items 3 to 7 from above table combined (688-1918+283+1179-2) total 230. Recording this figure on 26th May and zeroing existing entries can be a quick fix to the data, but the case requires a deeper investigation how Spanish data are reported. It is especially important if we take into account deaths surge reported Nov 4th. It looks like a data collection glitch, but it may as well represent valid data resulting from 2nd wave, so it definitely need investigation.

Added 2020-11-13:

It seems Spain has own understanding of time series. November spike comes from re-stating definition of Covid-19 deaths. Why do they post +1300 deaths occurred prior to 11th May together with current data (297 deaths on 2020-11-04) in November is hard to comprehend. Such an approach clearly distorts 2nd wave statistics. https://www.aa.com.tr/en/europe/spain-s-covid-19-death-toll-surges-by-1-623/2032447

Covidmeter 2020-11-08

Covidmeter shows number of cumulative Covid-19 deaths per 1 million people. Figure below displays top 5 countries in this ranking along with USA, Russia and Poland which were hand picked. Country rank in cumulative deaths is shown after its name. Diamond Princess and San Marino were added as reference and future impact prediction, please go to previous posts for rationale.

  1. No Covid-19 fatality was registered in San Marino since May.
  2. Belgium leads ranking again.
  3. Predictions regarding total population impact – 0.2% or 2000 fatalities per million made after Diamond Princess experience hold true. In fact no country so far exceeded San Marino figure.
  4. Covid-19 2nd wave in Belgium takes death toll while in Sweden deaths count is very modest.
  5. China (not shown on picture) unlike other counties it does not experience 2nd wave. They have either eliminated the virus (unlikely) or called off epidemic and focus on treating individual cases as they arise (probable).

Covid-19 deaths by age

Covid-19 deaths are usually reported as daily totals. It would be interesting to have a look into more details like deceased people age or health condition like chronic illness. Surprisingly such a data are not easily available. I’ve managed to get some detailed data on Covid-19 deaths in Poland, you’ll find them in this post.

Data set

Data presented here come form Poland Ministry of Health, I’ve got them on requests, they are not published regularly. The data represent period from 2020-10-09 to 2020-10-27. Received set has information on:

  1. death date
  2. death place
  3. sex
  4. age

The set has no information on chronic illness. Other statements from ministry show 90% of Covid-19 positive deceases had preexisting illness. Chart below shows age distribution for entire set.

  1. Very few people under 40 die with Covid-19
  2. It would be super interesting to compare above distribution with remaining deaths distribution. Around 1200 die in Poland on daily basis, max Covid-19 positive deaths are 179 in the set. Unfortunately I have no access to the latter distribution. I believe both will be similar. For avoidance of doubts: It does not mean Covid-19 is not dangerous for individuals who contract it.
  3. I believe epidemic dangerous for population should take its toll regardless of age, Covid-19 seems to focus on older ones

Males and females

Charts below show age distribution split by gender.

  1. Men have significantly higher death count till 80, after 80 both distributions are almost identical
  1. Men represent 58% of all deaths, male deaths are (1025-722)/722=42% higher than female

Table below compares age distribution in numbers. Age 25% means 25% of deaths in group are under this age. Please note average lifespan in Poland is 78 years.

allmalefemale
total deaths1747.01025.0722.0
average age75.874.278.1
most common age82.082.087.0
age 25%69.067.072.0
age 50%78.076.080.5
age 75%85.083.087.0

Conclusions

  1. There are little fatalities under 40, just 27 out of 1747 or 1.5%
  2. Covid-19 fatalities are much higher among men than women
  3. Death age distribution shows Covid-19 does not represent a significant threat for population since it spares younger part if it.
  4. Better quantitative analysis of Coviid-19 cases is needed. Number of cases and deaths are floated everywhere. Age of deceased was hard to get. I’ve seen no data on recovered ones like full/partial recovery, time between infection and recovery, hospitalization rate, intensive care time etc.
  5. Lock down or quarantine will not save us, working economy allowing better planning and execution of medical response will.

Covid-19 first and second wave compared

Comparing Covid-19 cases and deaths during first and second wave of epidemic reveals interesting facts. Daily cases during second wave exceed 1st wave figures, while for some countries daily deaths stay significantly lower. One country – Sweden seems to have Covid-19 resilience, people get ill but fatalities are rare.

Method

In order to compare 1st and 2nd wave we make charts for selected countries following steps below:

  1. Second wave data are shown from 1st Oct
  2. First wave data are taken form 15th Mar to 1st June and moved forward by 200 days so they start at 1st Oct after the shift
  3. Both 1st and 2nd wave data are presented on same chard for visual comparison
  4. Deaths per million people are shown on left axis, cases on right one

Belgium

  1. We see daily cases during 2nd wave (peak 1600) significantly surpass 1st wave (peak 200).
  2. Daily deaths are lower during 2nd wave (peak 5) than 1st (peak 25). Of course 2nd wave figures may go up, but so far cart clearly shows daily deaths dynamics is significantly lower during 2nd wave.
  3. Please note recent drop of cases and deaths figure is due to data collection method. Initial data are not accurate and take 3 days to be refined, so both numbers are likely to be revised up.

Netherlands

  1. We see pattern similar to Belgium one: cases 100 vs 600, deaths 14 vs 3. Second wave brings more cases but less deaths
  2. Please note 2nd wave cases for Belgium (1600) more than double Netherlands (600). Belgium mandated face masks in public spaces much earlier than Netherlands, so mask magic should be treated with a grain of salt. Cases detected may be correlated with tests performed, unfortunately ECDC data set I use has no information on tests.

Poland

  1. Both cases and deaths during 2nd wave significantly exceed 1st wave figures.
  2. Lock down during 1st phase delayed Covid-19 impact but failed to eliminate it

Czechia

  1. Czechia shows similar pattern to Poland, unfortunately its cases and deaths figures are much higher
  2. Czechia 2nd wave daily cases are similar to Belgium, but daily deaths are much higher (12 vs 5 for Belgium)

Sweden

  1. Sweden daily cases 2nd wave exceed 1st wave figures, but difference is not as high as Belgium one (2x vs 8x)
  2. There is no growth in daily deaths, figure stays around 0. In other words people get sick but fatalities are rare. It looks as if Sweden population built Covid-19 resilience.

Conclusions

  1. Sweden approach to epidemic worked best so far. First wave may have taken longer, but apparently country population build Covid-19 resilience. This is not immunity, people still get ill but fatalities are rare. I would not call it herd immunity since nobody knows how herd immunity is defined.
  2. Countries with high daily deaths rate during 1st wave have significantly lower rates now. Cumulative deaths estimates as presented in Covidmeter remain valid.
  3. Countries with low death rates during 1st wave are catching up now. For them lock down measures of 1st wave were sort of futile. Of course situation would be different had Covid-19 medication had bee discovered by now.
  4. Panic can increase death toll. Patient with brain stroke or heart attack kept at hospital driveway for several hours due to unclear Covid-19 status is likely to die. Medical personnel adequately equipped with protective gear should be able to treat urgent cases accepting reasonable infection risk.