Cumulative Covid-19 cases are growing over time as long as epidemic is active, so does cumulative death count. Cases mortality defined as cumulative deaths to cumulative cases quotient varies over time. In this post we show how it evolved.
Chart below shows top 10 countries by cumulative Covid-19 cases per million inhabitants. It also shows Diamond Princess (cruise ship hit by Covid-19 at the beginning of pandemic) cumulative cases for reference.
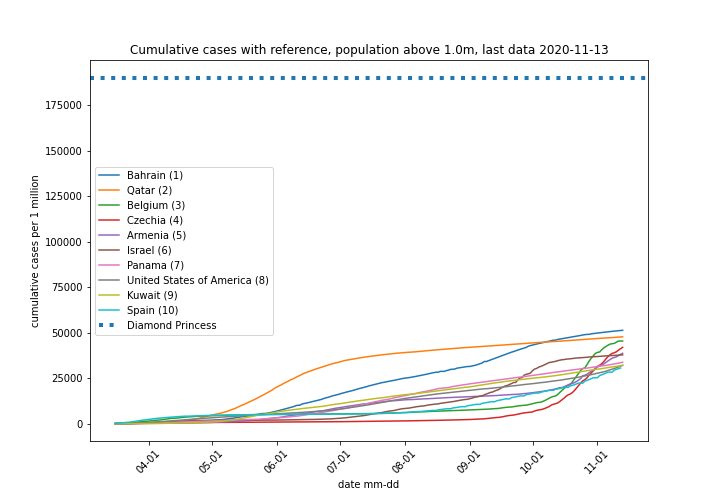
Cumulative cases ranking
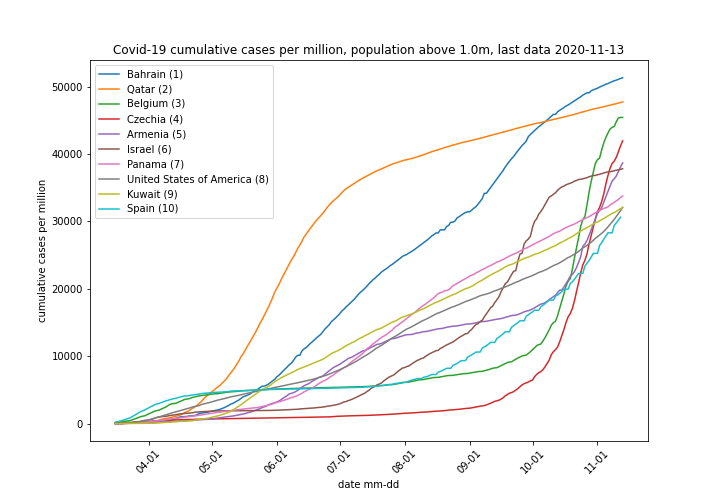
Top 10 countries by cumulative cases per million inhabitants are displayed on chart below, data are the same as above, but removed reference line changes y-axis range. We see leaders in ranking come form Persian Gulf area, they are closely followed by European countries. US (8) has the most cases in absolute numbers. Please note China – the source of problem is not there. They have either managed to eliminate Covid-19 or understood real risk relate to it and quenched media hype around it. I think the latter is true.
Mortality evolution
Chart below shows how Covid-19 mortality changed over time. Country list is top 10 by cumulative cases discussed above. Country rank in cases mortality is displayed next to its name. We see leaders of cumulative cases ranking Bahrain, Qatar have very low mortality. This may be due to climate, genetic difference, or just better overall quality of health service including widespread testing from epidemic onset. Please note for Belgium, Spain and US mortality rate dropped with growing number of cumulative cases. The easiest explanation is growth of testing capacity resulting in better detection.
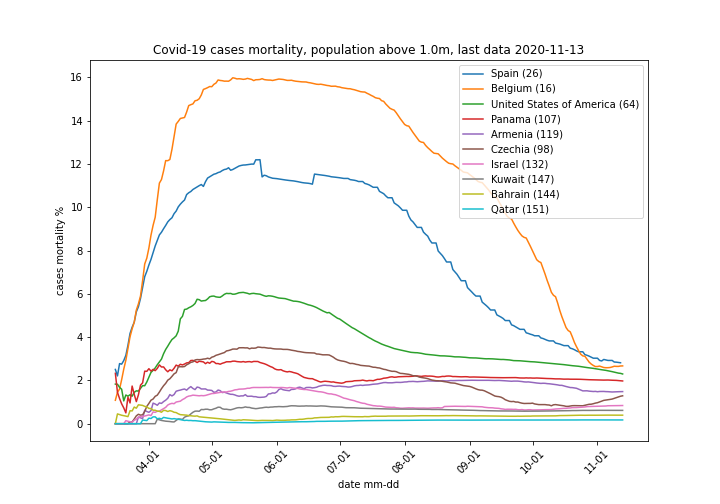
Table below shows country details, Countries are sorted by cases mortality value at latest data point (end of curve). Please note difference between Spain with current (cumulative) cases mortality at 2.8% and Qatar 0.17% is over 10 fold. For comparison Diamond Princess cases mortality was around 1%.
| Country | Cases Mortality % | Cumulative Cases | Cumulative Deaths | |
|---|---|---|---|---|
| 1 | Spain | 2.82 | 1437220 | 40461 |
| 2 | Belgium | 2.67 | 520297 | 13891 |
| 3 | United States of America | 2.30 | 10554801 | 242430 |
| 4 | Panama | 1.97 | 143352 | 2830 |
| 5 | Armenia | 1.48 | 114383 | 1697 |
| 6 | Czechia | 1.29 | 446675 | 5755 |
| 7 | Israel | 0.84 | 322159 | 2706 |
| 8 | Kuwait | 0.62 | 134932 | 830 |
| 9 | Bahrain | 0.39 | 84192 | 332 |
| 10 | Qatar | 0.17 | 135132 | 234 |
Conclusions
- Cases mortality goes down with number of cases detected. This shows high mortality readings are related to poor testing.
- Seasonal flue mortality according US CDC is around 0.15%. This is compatible with Covid-19 mortality in Qatar, while US figure is much higher 2.3%. Covid-19 toll may be inflated if all deceased with active Covid and other diseases are attributed to the former. Such an approach is initially prudent, but leads to impact overestimation.
- Taking into account impact of Covid on economy and society quality and quantity of data available is far from satisfactory. Those who have relevant data (China?) handle situation much better with more confidence.