Natural gas market price in European Union and USA is different for a reason. EU has limited deposits and imports substantial amounts of natural gas, while US has vast resources and was the largest liquefied natural gas (LNG) exporter in 2023. Gas trading ecosystem is complicated there are many bilateral agreements with undisclosed price terms. However both US and EU have gas trading hubs with both spot and futures market prices publicly quoted, they often serve as benchmark to other contracts. In this article we compare Henry Hub (US) and TTF (EU, Netherlands) natural gas prices and how Ukraine war impacted them.
Gas price change over time
Data used for comparison come from Yahoo via Python API. I can share Jupyter notebook used to make figures, just let me know. Henry Hub quotes gas in USD/MMBTU (million British thermal units) while TTF uses EUR/MWh (1 MWh = 3.4121 MMBTU). Besides HH and TTF prices figure below shows North Stream gas price and retail price in Poland set by regulator.
North Stream was a direct connection between Russian and German systems. Gas price was set by bilateral contract, details are unknown. I’ve heard a rumour the price was set to 82 EUR/1000m3, which seemed too low to be true. What is true is 84.9m3 of natural gas represents 1MWh. North Stream gas (alleged) gas price converted to EUR/MWh was marked on figure below. As we can see Henry Hub price in peacetime is compatible. Each fairy tale has grains of truth.
Retail “frozen price” was set by market regulator in Poland to shield customers from wild raise of market gas price. Gas distribution company (state owned PGNiG) was compensated for retail losses. However protection system was not set for commercial customers, who experienced 10x or so price hike. I remember discussion with sport club owner who was forced to switch off tennis courts heating and cancel classes for children because of gas cost. As we can see frozen price is slightly above average TTF gas price in 2023. Of course 2022 was another story.
Frozen gas price is in force till mid 2024, once it expires gas price cap set by regulator will be in place. The cap is 50% higher than frozen price and more than double current TTF price.
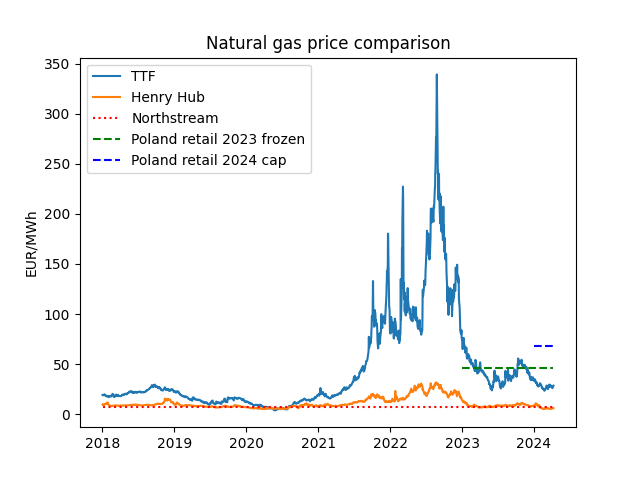
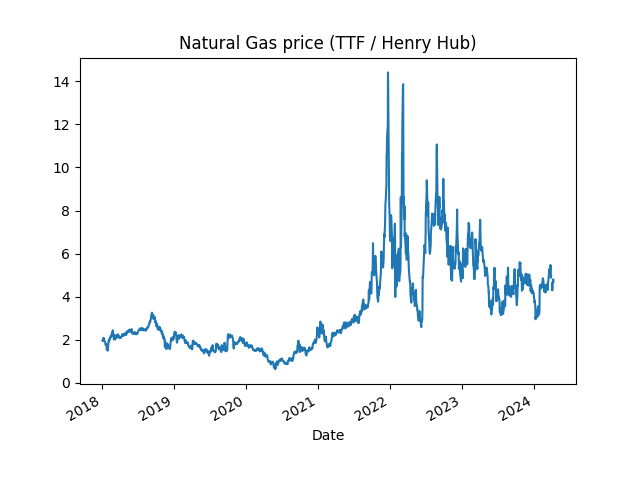
Historically TTF gas price was above Henry Hub. Gap closing in 2020 took place during COVID-19 outbreak and widespread lock-downs resulting in demand drop. Briefly TTF gas price was even below Henry Hub, but 2020 is a very special case. In 2021 price gap widened, maybe gas prices were predicting Ukraine war? War outbreak in 2022 resulted in wild gas price rise in EU. It is not surprising since more than 50% of gas was imported form Russia and this source was abruptly cut. At some point TTF gas was 14 times more expensive then Henry Hub. Situation started to normalize in 2023, difference between markets was still high but at least wild price swings in EU somehow subdued.
Average price comparison
Figure below shows average gas price for Henry Hub and TTF calculated on annual basis. US prices returned to prewar level, while EU stay elevated.
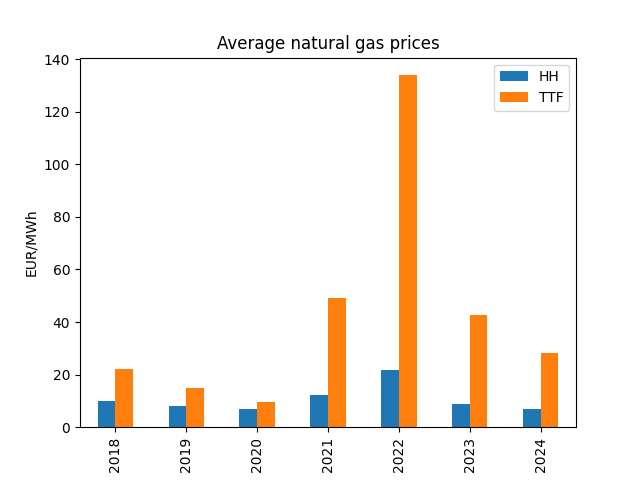
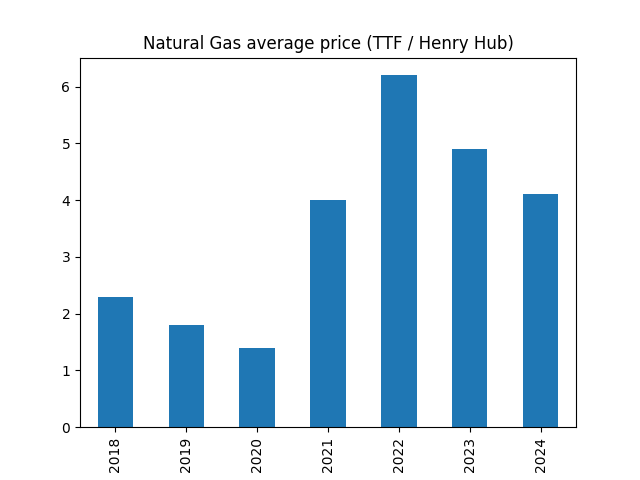
Figure below shows average TTF/HH price ratio. We can say gas in EU before war traded at double US price, first year of war made it 6 times more expensive, now it trades 4 times US price.
War losses
EU countries use over 300 billion (300e9) m3 of natural gas per year, this equals 3.5 billion MWh (3.5e9). Using average gas prices we can estimate monetary impact of price hikes. Assuming prewar price at 20 EUR/MWh we have 110 EUR/MWh extra in 2022 and 20 EUR/MWh in 2023. It gives 385 + 70.0 = 455 billion EUR. High energy cost and volatility pushes manufacturing to leave EU. This affect not only GDP but also defense capabilities, Ukrainian shows it’s hard to fight modern war without industry base.