Drawings and tables from 04-05 post updated with 04-06 data. For explanation please go to the original. Since France cases mortality rate was going up rapidly we’ve made it country in focus.
Continue readingCategory Archives: Covid-19
Covidmeter – Covid-19 deaths in numbers
Covid-19 is taking a death toll, but is it significant from population perspective? We crunch some ECDC data released 5th of April, to measure how severe is Covid-19 impact so far on human population. We use this opportunity to refine Covidmeter concept introduced in previous post.
Continue readingCovidmeter debut for Italy
Death is definitive. We are in Lent period, approaching Passion Week, resurrection promise is important for some of you. However for Covid-19 impact measurement purposes death is definitive enough. Number of infection cases can be under estimated, especially if there is no proper test coverage of entire population. Cases not producing symptoms or producing light/moderate symptoms are likely to stay under radar. Death cases are investigated thoroughly, every Covid-19 infection is likely to be discovered in post-mortem. We can use population mortality rate as a measure of Covid-19 epidemic development. We will name it Covidmeter for brevity. Let us present how it links with data.
Continue readingCovid-19 cases, deaths and mortality rate
Let’s have a closer look at Covid-19 mortality rate. We focus on mortality among detected cases, since population fraction affected is still very tiny. Mortality rate defined as quotient of cumulative death cases and cumulative detected cases can vary between 0.3% and 11%, a factor of 30 difference. Quite a significant difference indeed.
Data in table below below come from 2020-03-30 ECDC set, columns are explained below the table. As predicted in my previous post USA took the top spot in number of Covid-19 cases, China is now number 3, Spain will likely displace it on March 31st. Please note China started to report new cases albeit number is low (121).
| DateRep | CountrY | Cases | Deaths | CCases | CDeaths | Mort% | pop2018 | |
|---|---|---|---|---|---|---|---|---|
| 0 | 2020-03-30 | United States of America | 18360 | 318 | 143025 | 2509 | 1.75 | 327167434 |
| 1 | 2020-03-30 | Italy | 5217 | 758 | 97689 | 10781 | 11.04 | 60431283 |
| 2 | 2020-03-30 | China | 121 | 5 | 82463 | 3311 | 4.02 | 1392730000 |
| 3 | 2020-03-30 | Spain | 6549 | 838 | 78797 | 6528 | 8.28 | 46723749 |
| 4 | 2020-03-30 | Germany | 4751 | 66 | 57298 | 455 | 0.79 | 82927922 |
| 5 | 2020-03-30 | France | 2599 | 292 | 40174 | 2606 | 6.49 | 66987244 |
| 6 | 2020-03-30 | Iran | 2901 | 123 | 38309 | 2640 | 6.89 | 81800269 |
| 7 | 2020-03-30 | United Kingdom | 2433 | 209 | 19522 | 1228 | 6.29 | 66488991 |
| 8 | 2020-03-30 | Switzerland | 1122 | 22 | 14274 | 257 | 1.80 | 8516543 |
| 9 | 2020-03-30 | Netherlands | 1104 | 132 | 10866 | 771 | 7.10 | 17231017 |
| 10 | 2020-03-30 | Belgium | 1702 | 78 | 10836 | 431 | 3.98 | 11422068 |
| 11 | 2020-03-30 | South Korea | 78 | 6 | 9661 | 158 | 1.64 | 51635256 |
| 12 | 2020-03-30 | Turkey | 1815 | 23 | 9217 | 131 | 1.42 | 82319724 |
| 13 | 2020-03-30 | Austria | 522 | 18 | 8813 | 86 | 0.98 | 8847037 |
| 14 | 2020-03-30 | Canada | 869 | 1 | 6255 | 61 | 0.98 | 37058856 |
| 15 | 2020-03-30 | Portugal | 792 | 19 | 5962 | 119 | 2.00 | 10281762 |
| 16 | 2020-03-30 | Brazil | 352 | 22 | 4256 | 136 | 3.20 | 209469333 |
| 17 | 2020-03-30 | Israel | 628 | 3 | 4247 | 15 | 0.35 | 8883800 |
| 18 | 2020-03-30 | Norway | 257 | 2 | 4102 | 22 | 0.54 | 5314336 |
| 19 | 2020-03-30 | Australia | 284 | 2 | 4093 | 16 | 0.39 | 24992369 |
Table columns are explained below
- CASES, DEATHS – cases and deaths at reporting date (column DATEREP)
- CCASES, CDEATHS – cumulative cases and deaths
- MORT% – cumulative cases mortality rate CCCASES/CDEATHS in percentage points
- POP2018 – country population in 2018
Table below shows how top20 countries compare with entire world.
| top 20 | world | top % | |
|---|---|---|---|
| Cumulative cases | 649859 | 715669 | 90.8 |
| Cumulative Deaths | 32261 | 33574 | 96.1 |
| population 2018 | 2601228993 | 7459101652 | 34.9 |
| count | 20 | 196 | 10.2 |
As we see top 20 countries cover 91% of Covid-19 cases detected worldwide and account for 96% deaths. Similar comparison for top 5 countries below:
| top | world | top % | |
|---|---|---|---|
| CumCases | 459272 | 715669 | 64.2 |
| CumDeaths | 23584 | 33574 | 70.2 |
| pop2018 | 1909980388 | 7459101652 | 25.6 |
| count | 5 | 196 | 2.6 |
From table above we see Top 5 countries: had 459272 cases 23584 deaths in total, for population of 1909980388, close to 2 billion (US, 10E9). Of course China contributes more than half of the latter number. Let’s calculate some rations for top 5 countries:
- cases/population 0.024%
- deaths/population 0.0012%
- deaths/cases 5.14%
First two numbers are distorted by China huge population count. Covid-19 outbreak in China is officially declared contained, other countries are in full swing. Last number is both concerning and interesting because there are countries with high and low mortality rates. Lets have a look at them. From top 20 countries we have selected 5 with lowest and 5 with highest mortality rate. Data are presented below sorted on cases mortality in highest to lowest order.
Low and high cases mortality countries
Table below show low case mortality countries selected form top 20 table:
| DateRep | Countries | Cases | Deaths | CCases | CDeaths | mort% | |
|---|---|---|---|---|---|---|---|
| 14 | 2020-03-30 | Canada | 869 | 1 | 6255 | 61 | 0.98 |
| 4 | 2020-03-30 | Germany | 4751 | 66 | 57298 | 455 | 0.79 |
| 18 | 2020-03-30 | Norway | 257 | 2 | 4102 | 22 | 0.54 |
| 19 | 2020-03-30 | Australia | 284 | 2 | 4093 | 16 | 0.39 |
| 17 | 2020-03-30 | Israel | 628 | 3 | 4247 | 15 | 0.35 |
High mortality countries follow
| DateRep | Countries | Cases | Deaths | cCases | CDeaths | Mort% | |
|---|---|---|---|---|---|---|---|
| 1 | 2020-03-30 | Italy | 5217 | 758 | 97689 | 10781 | 11.04 |
| 3 | 2020-03-30 | Spain | 6549 | 838 | 78797 | 6528 | 8.28 |
| 9 | 2020-03-30 | Netherlands | 1104 | 132 | 10866 | 771 | 7.10 |
| 6 | 2020-03-30 | Iran | 2901 | 123 | 38309 | 2640 | 6.89 |
| 5 | 2020-03-30 | France | 2599 | 292 | 40174 | 2606 | 6.49 |
As we can see there is a wide difference in case mortality rate, it range s form 11.04% for Italy to 0.35% for Israel. You can argue Israel is in early development, but Germany has mortality rate at 0.79% and it has 57 thousands cases which is comparable with mortality record beating Italy 97 thousands cases. Italy and Germany are very similar countries in terms of size, population, wealth, economic development. I see no other explanation for order of magnitude mortality rate difference other than Covid-19 testing approach, discussed in previous post. Let’s have a look at mortality rate evolution over time.
Cases mortality rate evolution
We show picture for low cases mortality countries first. Data are shown as soon as cumulative deaths exceed 5. This eliminates initial fluctuations.
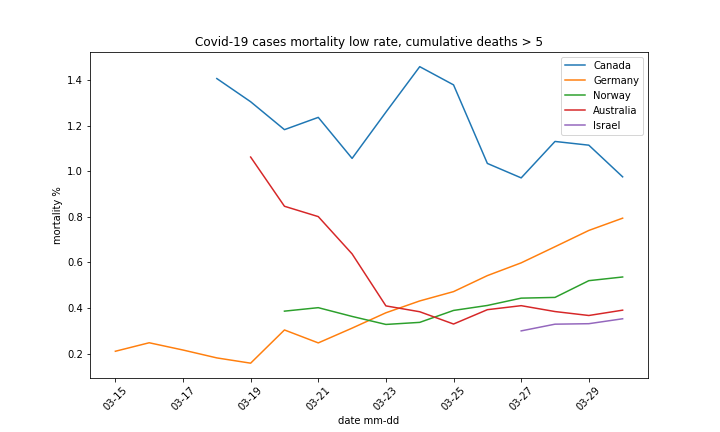
Please note Germany started with mortality rate around 0.2% of detected cases and its stayed at that level quite long. I believe the rate started to climb once growing number of cases made test diverted from general application to heavier cases. This is positive scenario.
For high mortality rate countries we show data once cumulative death cases exceed 20. Again this eliminate early fluctuations. Iran was an extreme example here, initial number of deaths equaled number of cases. Iran example shows how testing influences detected cases mortality rate.
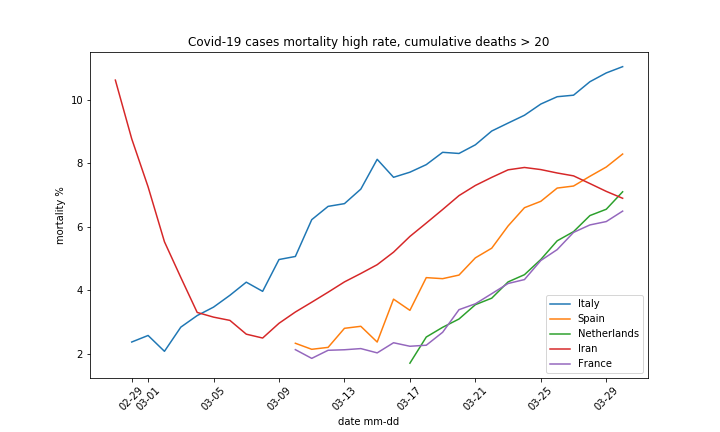
One more comment on Iran curve. Is started very high, dropped to 2% range, then climbed back in a almost Italian fashion (favorite explanation lack of test of course). Recently we see Iran detected case mortality heading down. Iran rate is going better than for other high mortality countries. Does a poor Iran has a more reasonable approach to disease handling than wealthy European countries? They may have less means but doe to recent turbulent history has much more experience in handling emergency situations, thus better allocation of its limited resources.
Figure below shows low and high rate countries combined. Some low rate countries don’t qualify since 20 cumulative deaths threshold is applied.
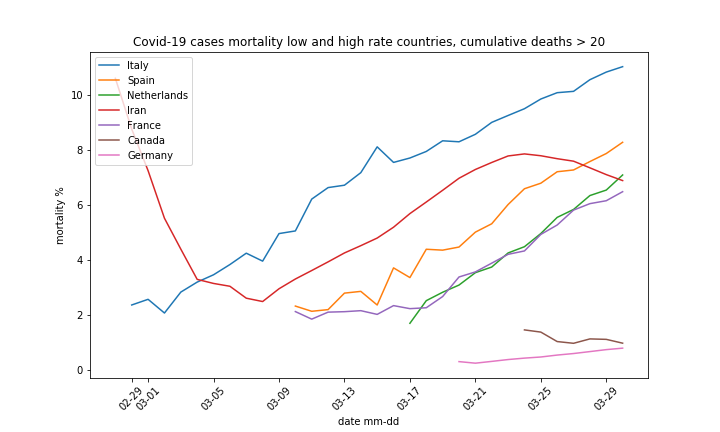
It extremely important to understand cases mortality difference between Germany and high rate countries. It would allow us to estimate actual Covid-19 impact on population.
Final remarks
I write a lot about importance of broad population testing. I believe difference in cases mortality rate comes from distortion of cases detection process in high mortality countries. Tests are scarce and used on heavier cases, more likely to end as fatalities, thus mortality rate goes up. I try to get a reliable data on number of tests performed in countries, but no success so far. I have contacted ECDC (European Centre for Disease Prevention and Control) my primary source, but thy have no such data data available. I see no other way to estimate true number of Covid-19 cases in population than a test on a random sample coming from actual population distribution. This process has to be separate from testing patients showing clear Covid-19 symptoms. If anyone knows where to find a reliable data on number of tests performed in countries I’d appreciate if you share it.
Covid-19 mortality rate estimation for closed population
Among news on growing Covid-19 threat and lock downs we forgot about an early outbreak on Diamond Princess cruiser ship. The case gives us opportunity to learn how Covid-19 develops in human population and measure its impact in terms of infection and mortality rate . I found Diamond Princess case a couple of days ago, while preparing data for this post. Then it made to top 20 countries by number of detected Covid-19 cases. I was looking at this group and a strange country coded JPG11668 attracted my attention, it turned out to be Diamond Princess cruise ship. As of 26th March ECDC data JPG11668 does not qualify to top 20, it ranks 39. I would have missed it if only it was positioned like that a couple of days ago. Sometimes a pure luck reveals an important piece of information. This one allows to estimate Covid-19 target infection rate at 20% and mortality at 0.2% of total population affected.
Table below displays countries and regions sorted according to cumulative Covid-19 cases detected. China remains a leader, Italy is the second. Judging from recent progress US is likely to overtake China soon. Italy is a sad leader in fatalities, growing to more than double Chinese figure. Diamond Princess (JPG11668) is easily dwarfed by above numbers.
| GeoId | Countries and territories | CumCases | CumDeaths | CasesMortality% | |
|---|---|---|---|---|---|
| 0 | CN | China | 81968 | 3293 | 4.02 |
| 1 | IT | Italy | 74386 | 7505 | 10.09 |
| 2 | US | United_States_of_America | 69194 | 1050 | 1.52 |
| 3 | ES | Spain | 47610 | 3434 | 7.21 |
| 4 | DE | Germany | 36508 | 198 | 0.54 |
| 5 | IR | Iran | 27017 | 2077 | 7.69 |
| 6 | FR | France | 25233 | 1331 | 5.27 |
| 7 | CH | Switzerland | 9714 | 103 | 1.06 |
| 8 | UK | United_Kingdom | 9529 | 422 | 4.43 |
| 9 | KR | South_Korea | 9241 | 131 | 1.42 |
| 39 | JPG11668 | Cases_on_an_international_conveyance_Japan | 705 | 7 | 0.99 |
Covid-19 on Diamond Princess
I found information on Diamond Princess on National Institute of Infectious Diseases (NIID) page. The source is close to subject since she is mooring in Yokohama Japan. As of 5 February, there was a total of 3711 individuals on board the Diamond Princess, with 2666 passengers and 1045 crew members. Actual number of death cases is 7.
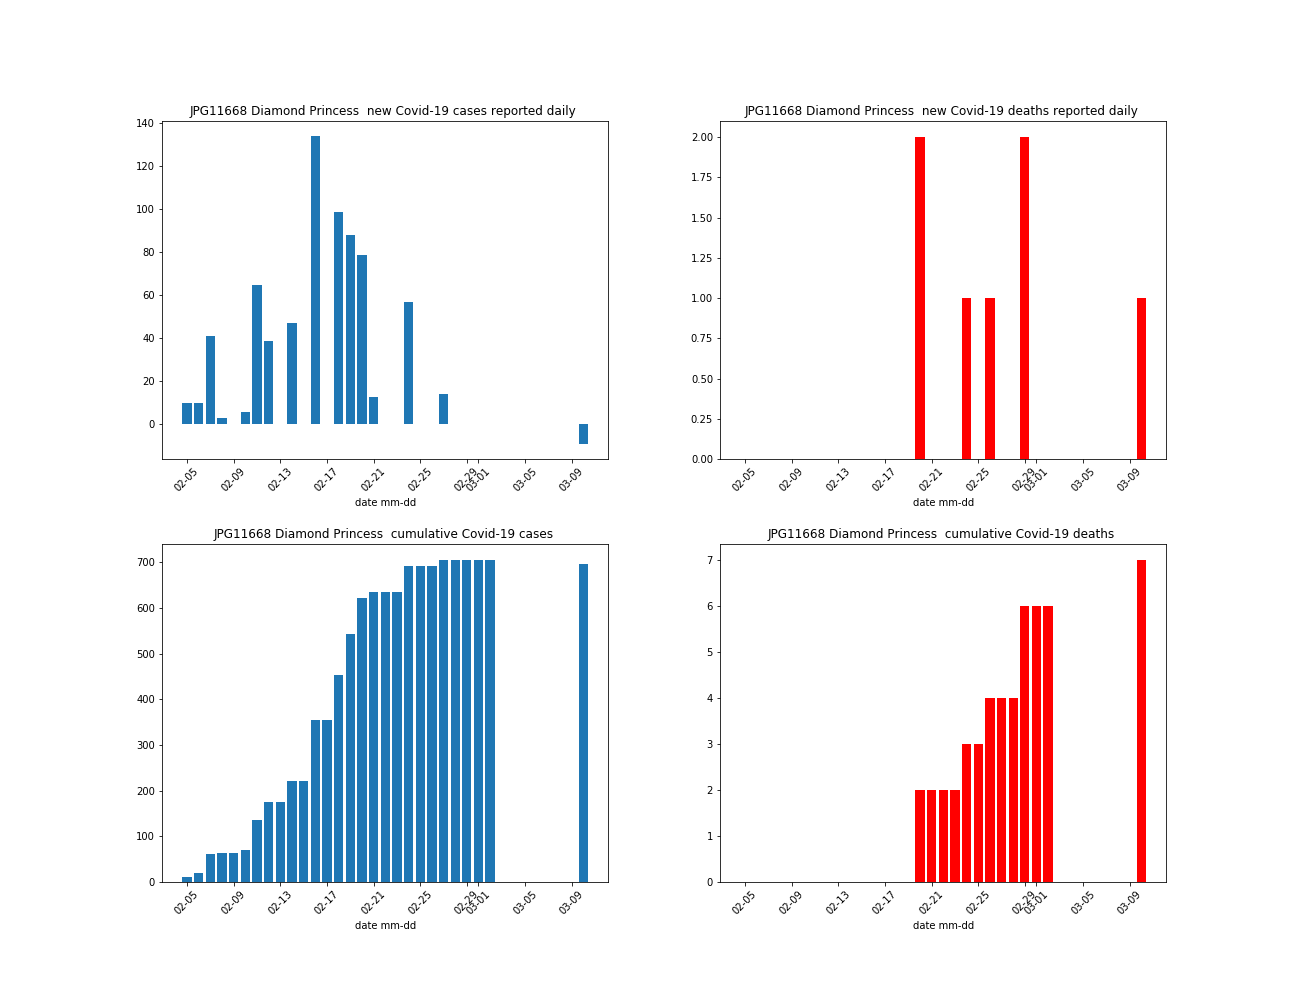
Chart below shows Covid-19 cumulative cases evolution and mortality among detected cases. Diamond Princess population was thoroughly tested, with almost 100% of passengers and crew covered. We can assume all Covid-19 cases were detected.
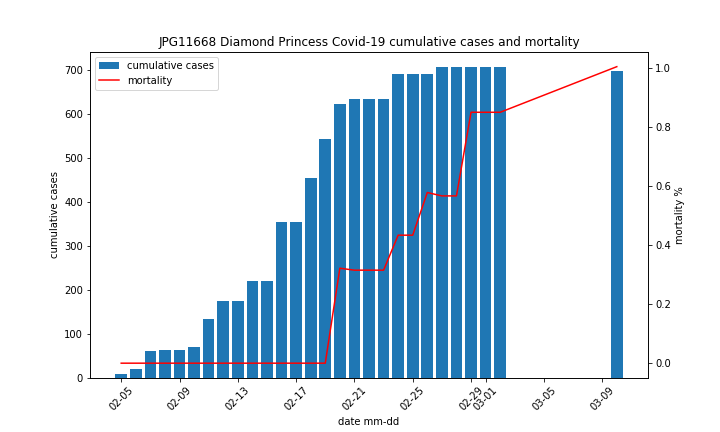
Chart below shows detected cases and mortality data, bot per day and cumulative figures. Gaps on cumulative data are due to gaps in ECDC data set. Most probably reporting was discontinued once disembarkation completed on Feb 28th. However on 03-10 there was another death case reported making a total of 7. This day data shows a negative (-9) number of cases. The latter figure is bit unusual, since ECDC showed only new cases as positive number. Perhaps it reflected some data correction e.g. previously reported cases were false positives. Lack of recovered cases reporting is one of ECDC data improvement areas.
Quarantine efficiency
Let’s have a look at timing data:
- 2020-02-05 first case reported
- 2020-03-10 last case reported
- 2020-02-16 peak cases reported per day
- 34 days between first and last case
- 11 days between first case and peak
Covid-19 spread was quick, start to peak in just 11 days. Cruising ship is a confined space pretty crowded comparing to on shore standards. Diamond Princess was not build with passenger isolation in mind and it was hard to convert her into mass isolation facility. Quarantine was called for cases on board, but how effective was it? In my opinion everyone on Diamond Princess had contact with Covid-19 virus and chance to contract it. Faster disembarkment would slow down/limit the virus spread at expense of greater on shore transfer risk. It is an old custom to prevent ship with disease outbreak to enter port (yellow flag).
Around 20% of population as infected 80% was not. I would attribute this split to natural resilience to Covid-19 in 80% of ship population, who were exposed to the virus but did not contract illness. Cruise ship crew and passengers can be considered a random sample drawn from population. There is a good chance Diamond Princess case models Covid-19 outbreak in any population.
Population impact
Chart below shows Diamond Princess population share infected by Covid-19. We divide number of detected cases by total ship population (3711). Infection share peaks around 20% (19% technically speaking,). Slight drop at the right end side results form negative new cases number reported 10.03 discussed above. Red bars show death cases (7), they distribute more or less evenly over time. For time series counting 7 samples it is hard to discuss curve shape. We can calculate mortality rate for population: 7/3711 gives around 0.2%
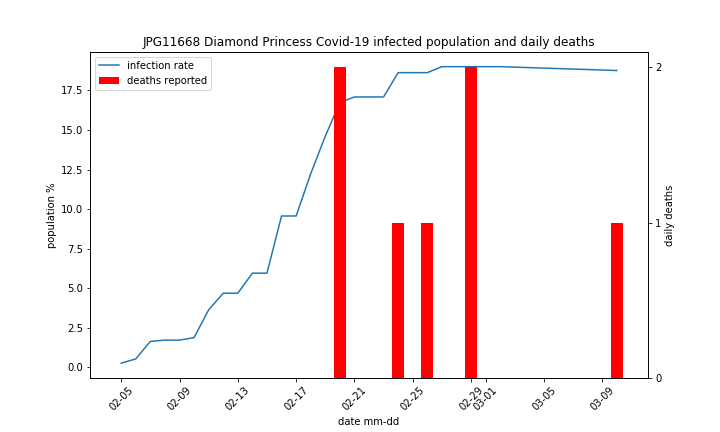
Diamond Princess infected population and mortality summary is the following:
- Population 3711, infected 696, dead 7
- 20% infection rate for population (696 out of 3711)
- Infection rate reached plateau after 20 days
- 0.2% mortality rate for population (7 out of 3711)
- 1% mortality rate for infected cases (7 out of 696)
Diamond Princess Covid-19 test penetration was almost 100%
Diamond Princess projection to countries
Projecting Diamond Princess data to counties is challenging since we are comparing fully developed disease with developing one. Countries differ widely by detected cases mortality rate. Table below in last column shows ratio of country mortality to the German one. There is a factor of 20 difference between Italy and Germany! In my opinion the only explanation is data sample distortion.
| Country | Cases | Deaths | Cases Mortality % | Mortality / Mortality DE | |
|---|---|---|---|---|---|
| 1 | Italy | 74386 | 7505 | 10.09 | 18.7 |
| 4 | Germany | 36508 | 198 | 0.54 | 1.0 |
| 11 | Austria | 5888 | 34 | 0.58 | 1.1 |
| 15 | Norway | 2916 | 12 | 0.41 | 0.8 |
| 39 | Diamond Princess | 705 | 7 | 0.99 | 1.8 |
Country sample distortion mechanism
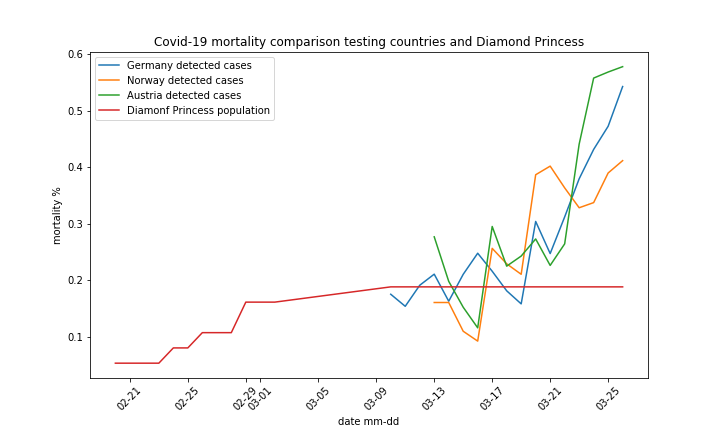
ECDC data set does not include number of tests performed in each country. I found some information Germany executed broad testing covering at least 250 thousands samples. While Italy was focusing on testing cases showing symptoms. Let’s suppose testing is a bottleneck, then the following picture will develop:
- Tests are available population is tested, positive cases emerge
- Initial fatalities are detected, mortality for detected cases is low
- Disease develops, more cases are detected, tests are running low, priority is given to cases with symptoms
- Cases with symptoms testing makes detected cases loaded with heavier ones
- Mortality rate in detected cases grows rapidly
- Growing number of cases creates positive feedback loop, mortality rate for detected cases soars
Recommendations for potential Covid-19 patients in Italy confirm above mechanism may be indeed in place. Stay at home if not experiencing serious problems eliminates light and moderate cases from sample, tests are run by hospitals. Picture below also supports our hypothesis. We see even for countries with high initial testing cases mortality starts to go up. Cases mortality for Diamond Princess stopped at 1%, it is not shown on chart (y scale limit), instead we show mortality for entire population. It topped at 0.2% with 20% of total population affected as discussed above.
Hope from numbers
Let’s assume in countries Covid-19 final stage will look like Diamond Princess. Penetration will reach 20% and mortality 0.2% population. Cases mortality will be 1%. We can then estimate actual cases figure from death count by simply dividing it by 1% (0.01). Results are in table below:
| Country | Cases | Deaths | Population | Estimated Cases | Estimated Penetration % |
|---|---|---|---|---|---|
| Italy | 74386 | 7505 | 60480 | 750500 | 1.24 |
| Germany | 36508 | 198 | 82790 | 19800 | 0.02 |
| Austria | 5888 | 34 | 8822 | 3400 | 0.04 |
| Norway | 2916 | 12 | 5368 | 1200 | 0.02 |
Please note: This section has been edited on 2020-04-02. Original version used 0.2% cases mortality, figure representing initial mortality for cases in Germany. Diamond Princess cases mortality was 1%. Of course recalculated estimate values are 5 times lower than original ones. There is a chance Diamond Princess case mortality can be revised down, but it requires a separate discussion.
Population data are in thousands. Cases and deaths are cumulative. Italy has a huge gap between detected cases and estimated ones. The later is close to a million. For Germany, Austria and Norway number of detected cases is higher than Diamond Princess figure. This may be related to either lower mortality rate, or time lag between epidemic start and fatalities build up. For Germany detected cases mortality fluctuated around 0.2% between 10 and 20 March and a considerable buildup of detected cases took place in that period. It makes me to believe German cases mortality rate may be around 0.2% not 1% like Diamond Princess.
Action needed
Run Covid-19 tests to verify actual penetration in Italy population. If discrepancy on cases is as huge as estimated (74 thousands detected vs. 750 thousands actual) it will be immediately confirmed by a simple statistical poll over representative sample drawn from population. If estimated penetration figure is confirmed current lock down measures have to be reconsidered.
Covid-19 why Germany is different from Italy
Covid-19 outbreak made me look at some data available from European Centre for Disease Prevention and Control (ECDC). The calamity has a lot of emotionally loaded media coverage, I’ll focus on numbers and conclusions that can be made from them. I use data coming from documented sources considered reliable. The data show results produced by same virus in various countries are widely different.
WHO defines pandemic as worldwide spread of a new disease. According to table below Covid-19 indeed matches this definition, it was detected in almost every country. Please note worldwide population is around 7.8 billion, so cases detected as of 2020.03.22 08:00 represent 0.0039% of the world population. Pandemic evolution should be viewed using affected population size as reference.
| cases | deaths | count | |
|---|---|---|---|
| world | 305275 | 12942 | 179 |
| top | 282564 | 12636 | 20 |
| top 20 % share | 92.6 | 97.6 |
Countries with most cases detected are listed in table below, ECDC naming is preserved. The table represents ECDC data as of 03.22.
| GeoId | Cases | Deaths | Countries and territories | |
|---|---|---|---|---|
| 0 | CN | 81499 | 3267 | China |
| 1 | IT | 53578 | 4827 | Italy |
| 2 | US | 26747 | 340 | United_States_of_America |
| 3 | ES | 24926 | 1326 | Spain |
| 4 | DE | 21463 | 67 | Germany |
| 5 | IR | 20610 | 1556 | Iran |
| 6 | FR | 14459 | 562 | France |
| 7 | KR | 8897 | 104 | South_Korea |
| 8 | CH | 6077 | 56 | Switzerland |
| 9 | UK | 5018 | 233 | United_Kingdom |
| 10 | NL | 3631 | 136 | Netherlands |
| 11 | AT | 3024 | 8 | Austria |
| 12 | BE | 2815 | 67 | Belgium |
| 13 | NO | 1926 | 7 | Norway |
| 14 | SE | 1746 | 20 | Sweden |
| 15 | DK | 1326 | 13 | Denmark |
| 16 | PT | 1280 | 12 | Portugal |
| 17 | CA | 1231 | 13 | [Canada, CANADA] |
| 18 | MY | 1183 | 4 | Malaysia |
| 19 | BR | 1128 | 18 | Brazil |
How Covid-19 started – early stage
First Covid-19 cases were reported in China and China outbreak made the virus famous. The virus comes form group responsible for common cold, but this mutation causes in some fraction of cases acute respiratory problems, pneumonia and may result in patient death even if treated in proper hospital. There is no known working vaccine, nor medication targeting the virus, its elimination depends on patient immunological system. My understanding is Covid-19 causes cold like illness that for some cases results in life threatening complications. I am not a medical professional, it may be over simplified. My goal is estimate infection complications probability from available statistics.
Early stage definition
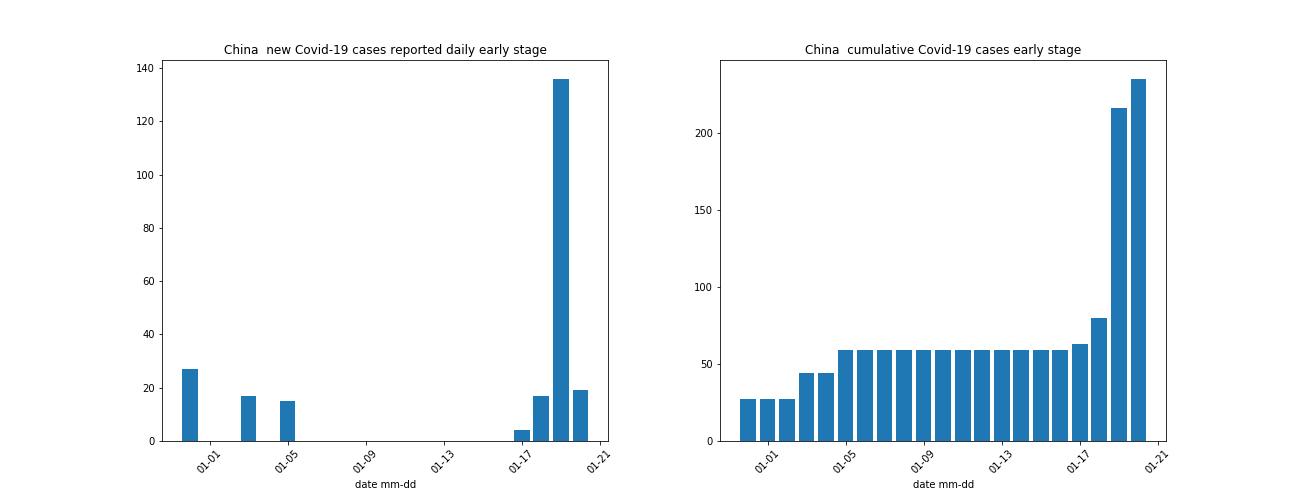
I define early stage of epidemic as period between 1st case and 300th cases detected in a country. The latter number is set arbitrary.
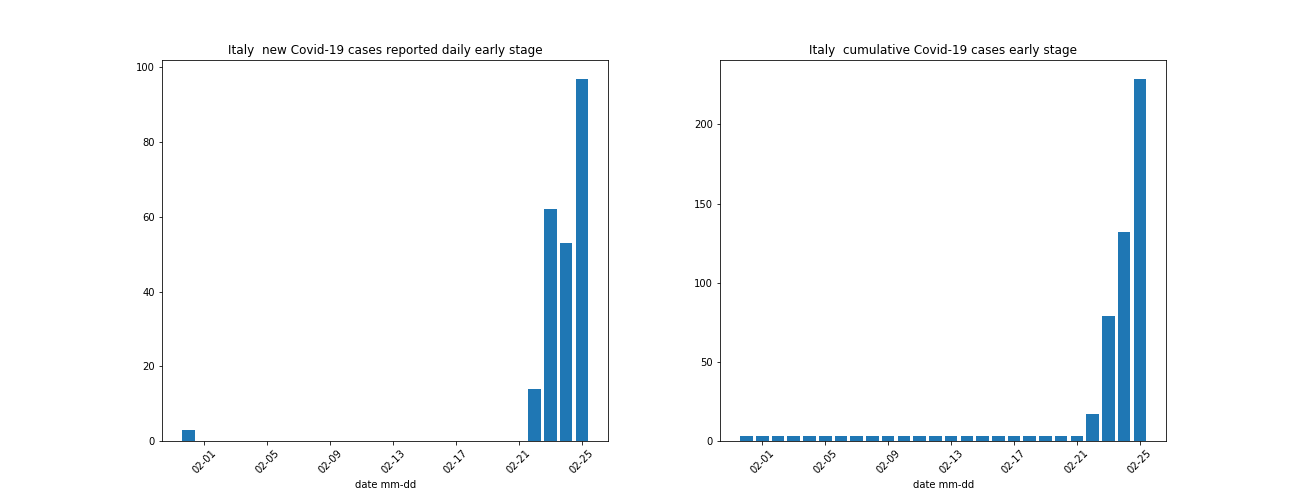
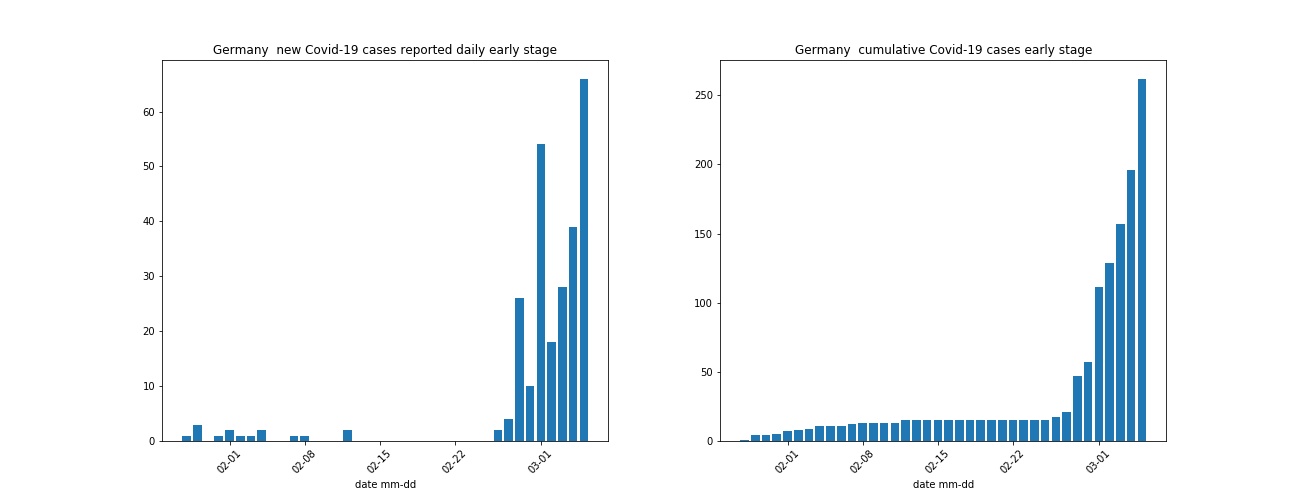
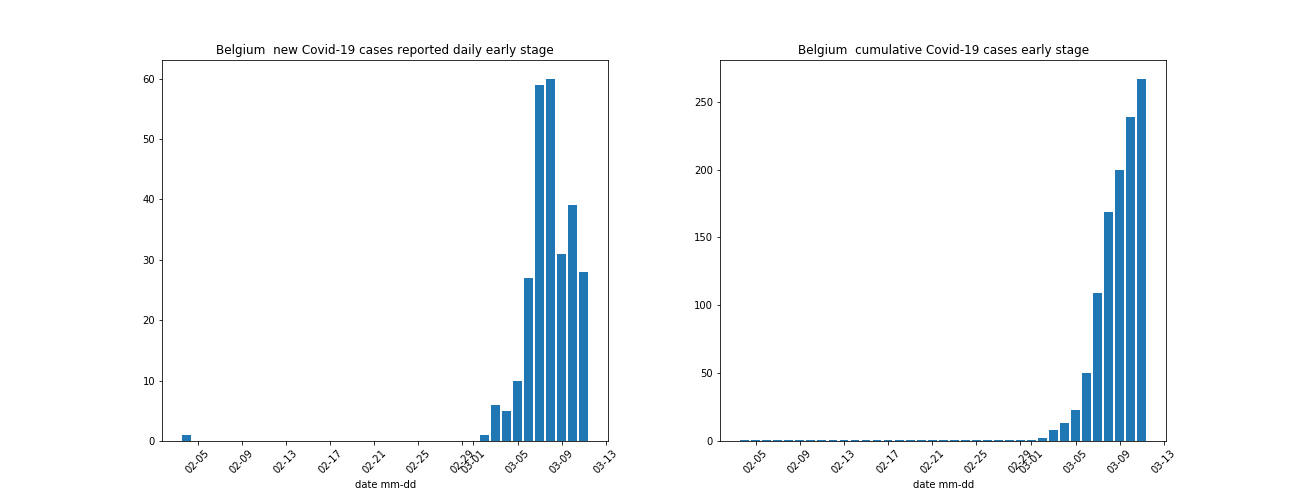
Early stage conclusions
- Early stage in China started end of Dec 2019
- Early stage in Europe started one month later than China
- Early stage lasted 3 to 5 weeks depending on country
- New year holiday season promoted silent transfer of virus
- Common cold symptoms allow Covid-19 move under disguise
- Covid-19 requires specialized tests to confirm
- Time from infection to life threatening symptoms development is probably long
- Steady buildup of acute respiratory problems cases in hospitals triggered epidemic alarm, increased testing followed
- Once road Covid-19 tests started, number of detected cases surged
Developed stage definition
I define epidemic is in developed stage in a country once cumulative number of detected cases exceeds 200. There is an overlap between early (up to 300) and developed stage (more than 200) and it is deliberate. Again 200 cumulative cases detected is arbitrary.
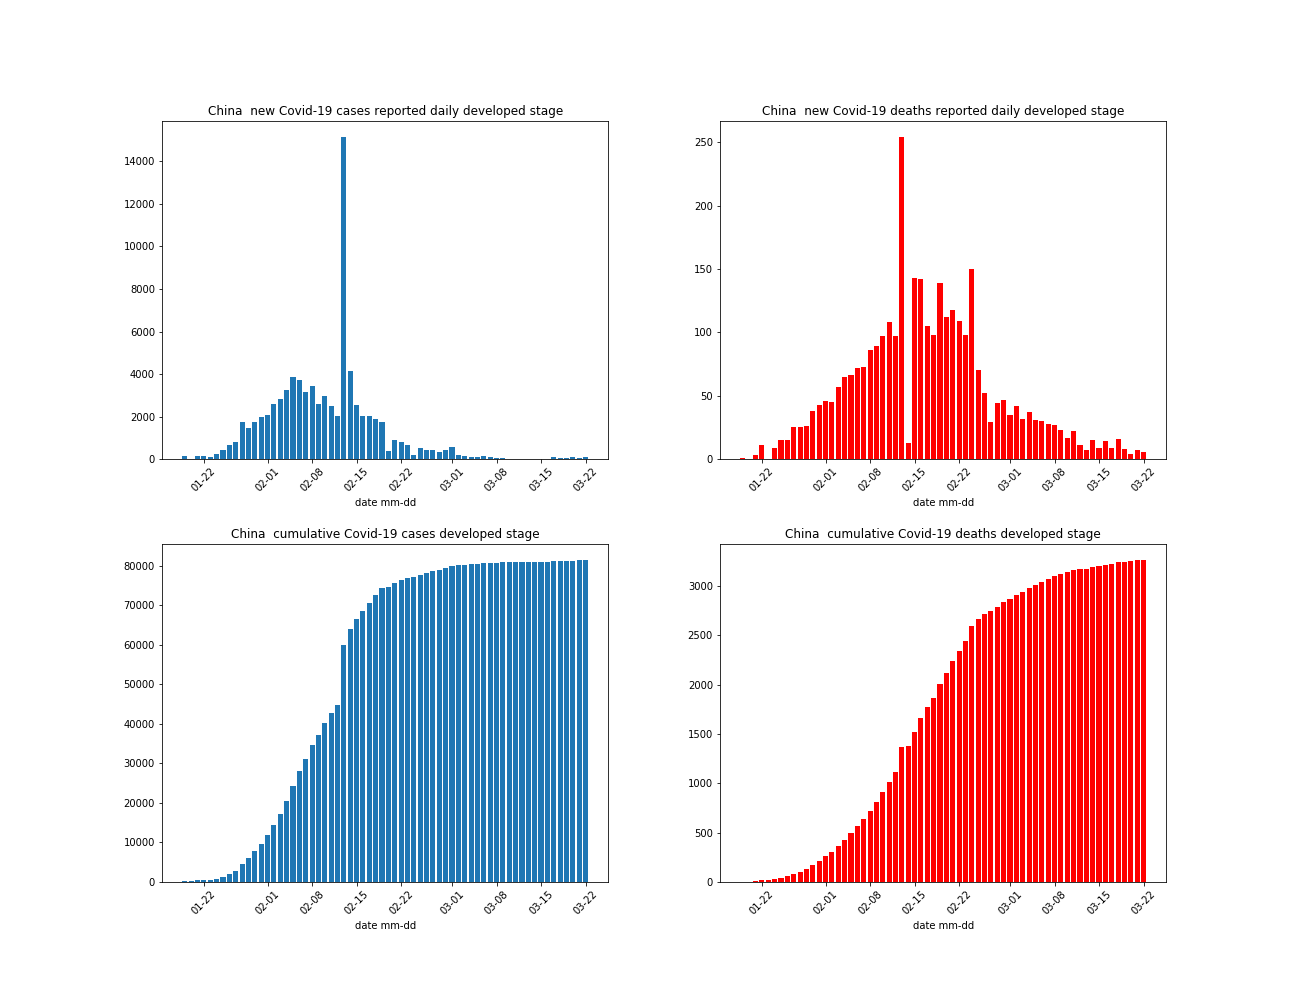
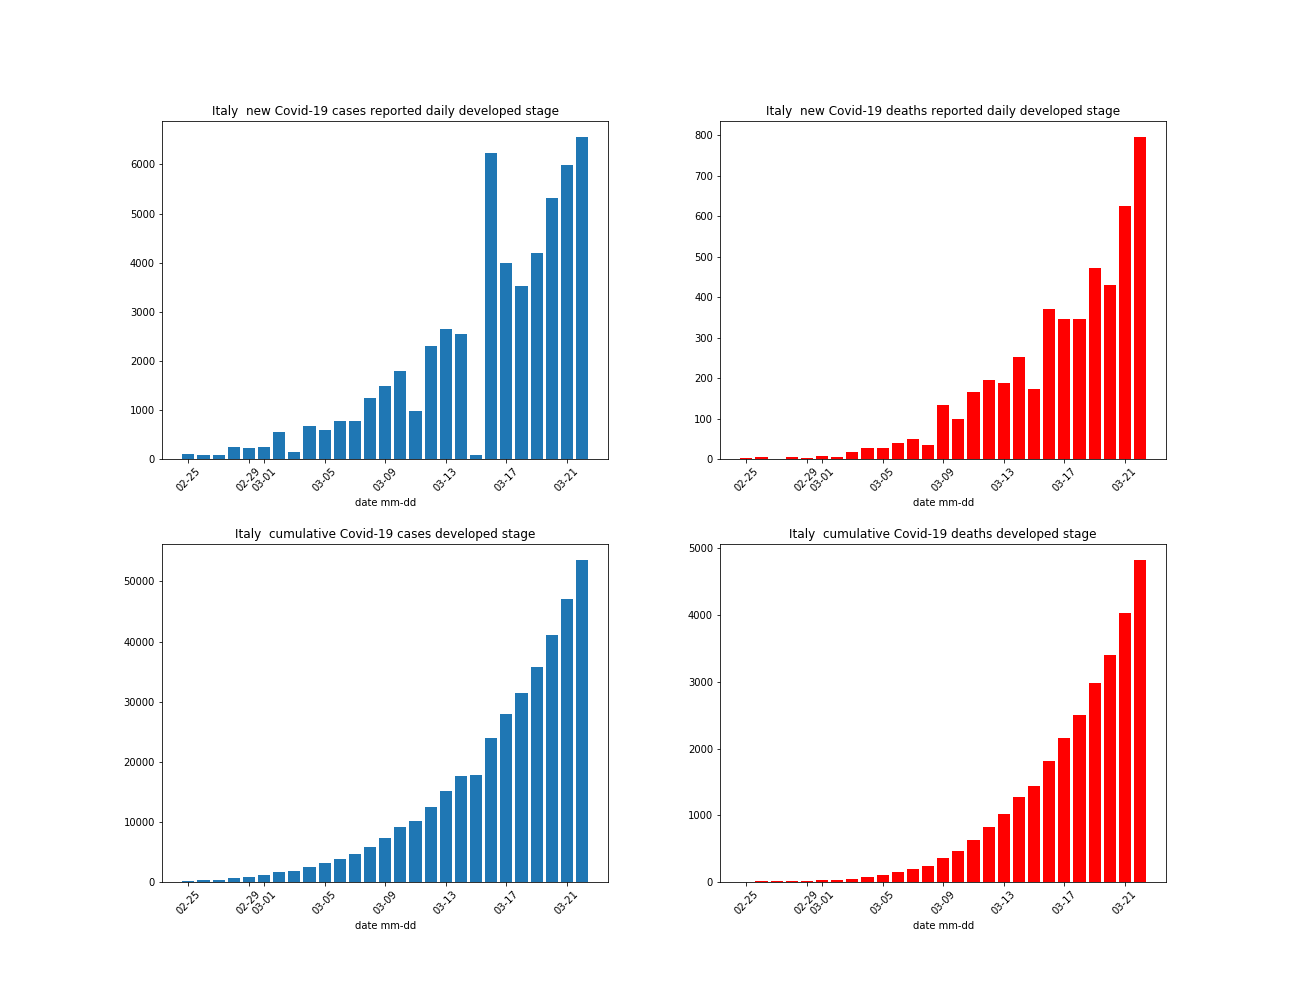
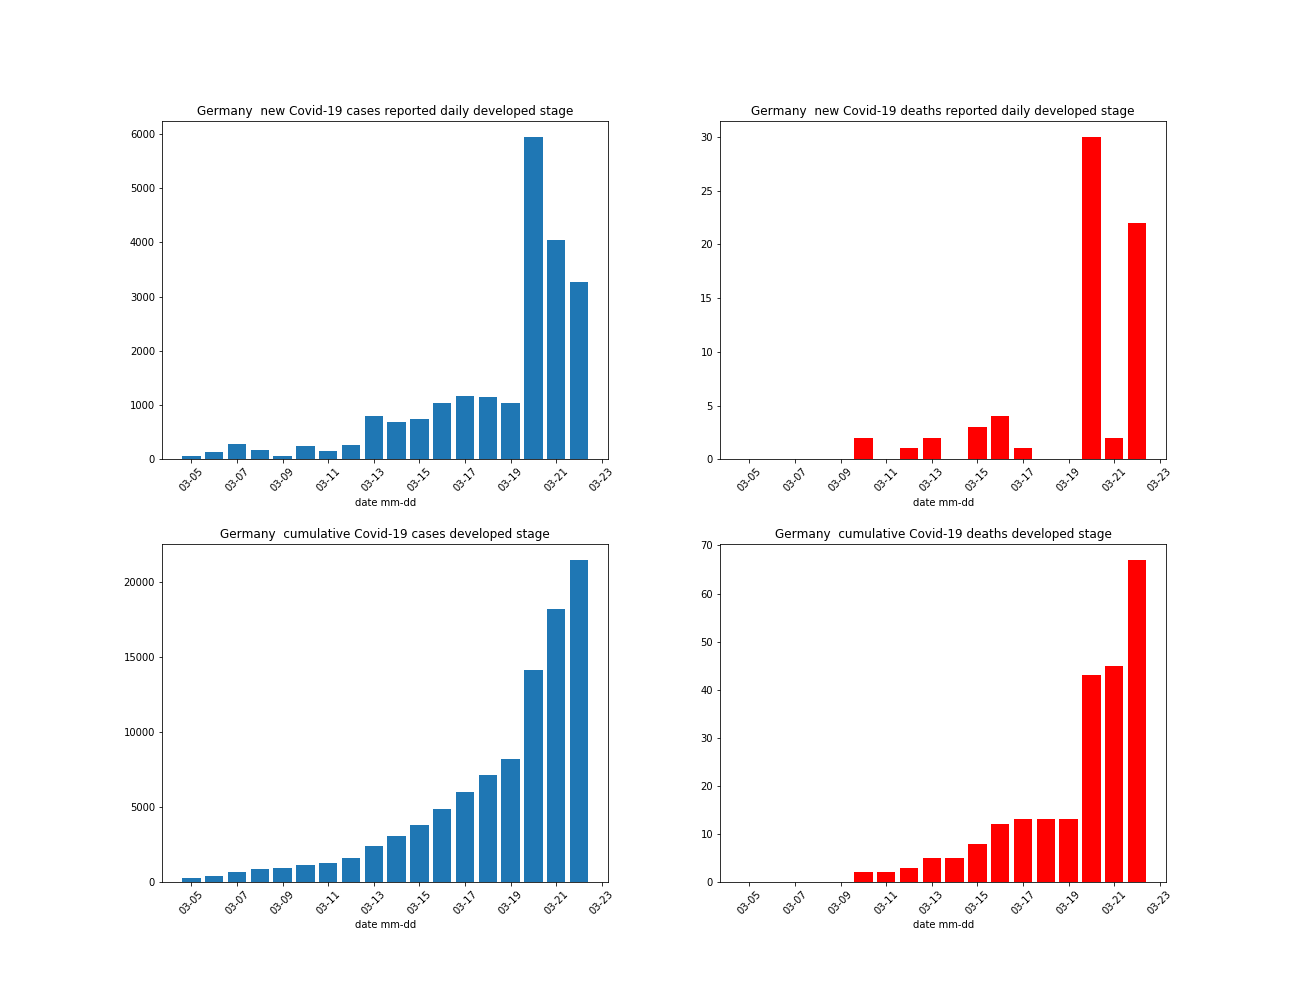
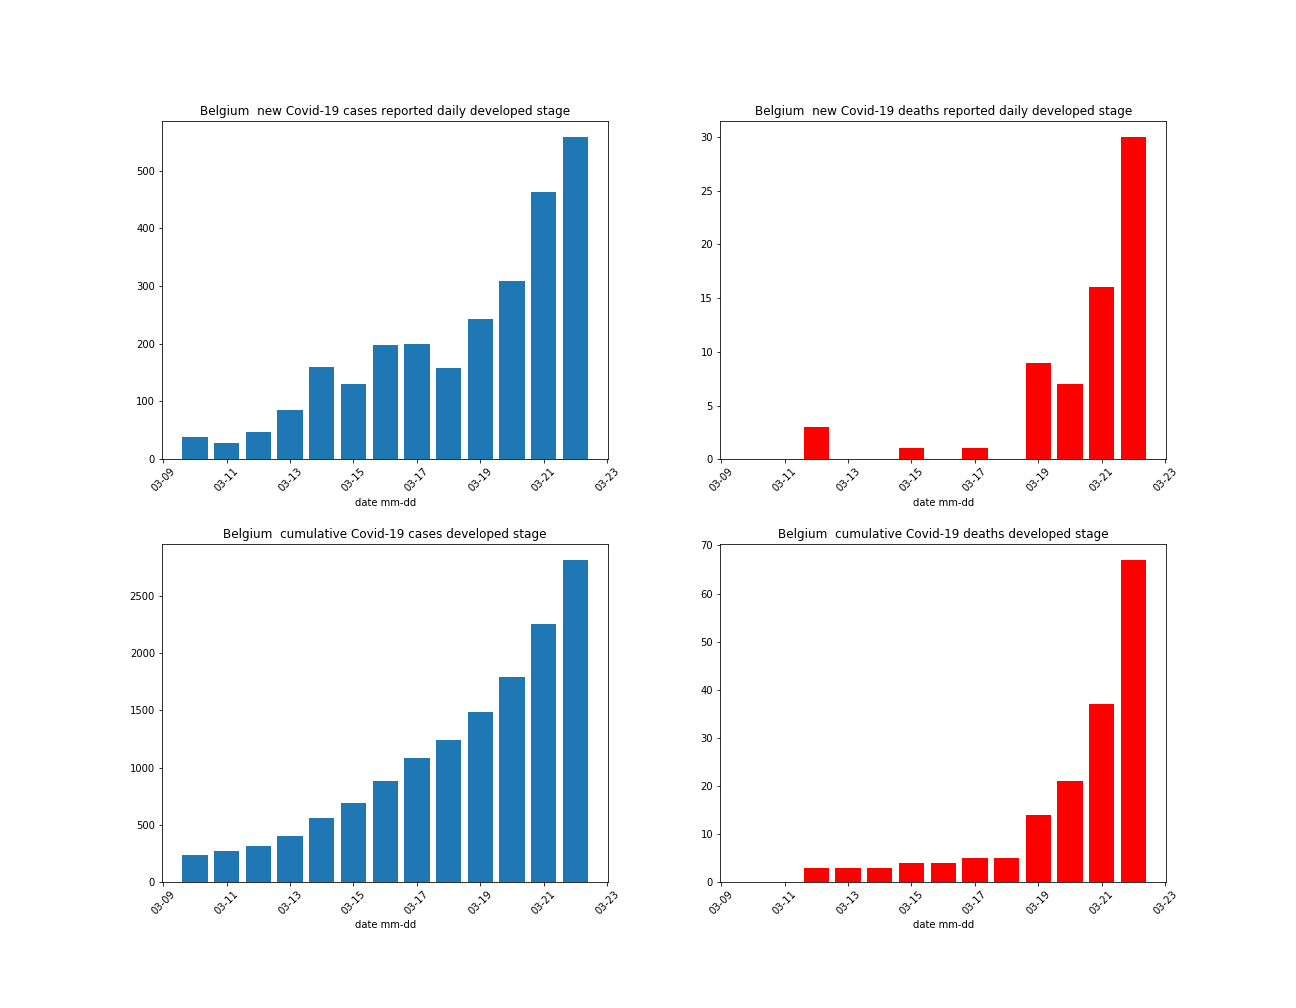
Developed stage so far (03.22 data)
China epidemic subsided. Unfortunately new cases are building up in Europe. Italy is most heavily hit. However close to 54 thousands detected cases in Italy translates to 0.09% of population (60 million). From pure volume perspective this is not a countrywide disaster yet, it may or may not develop into one.
Mortality rate
We define cumulative mortality rate dividing cumulative deaths by cumulative cases. Please note the latter number may be much less accurate than the former. We almost all fatalities with CoVID-19 symptoms are tested for virus, while general population is not. Thus actual number of cases can be much higher than detected one.
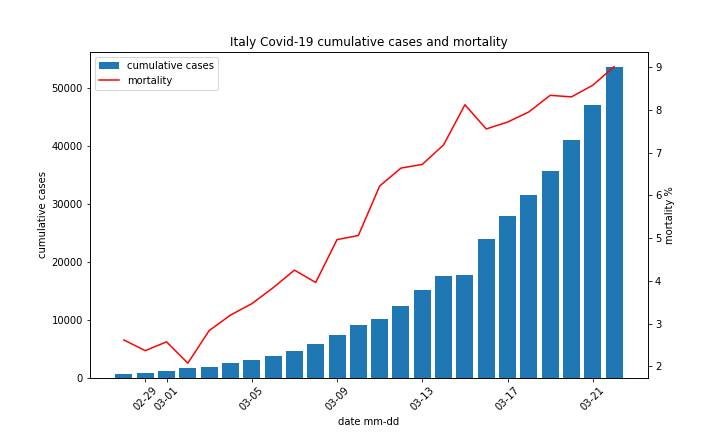
We see initial mortality rate was around 2-3%, which is consistent with WHO findings for China outbreak. Then the mortality rate started to climb. I believe it resulted from shortage of tests. Available ones were used on cases with severe symptoms qualifying for hospital treatment. Light cases were left undetected.
Mortality comparison
Following pictures show cumulative detected cases and mortality for top 8 countries selected after cumulative cases
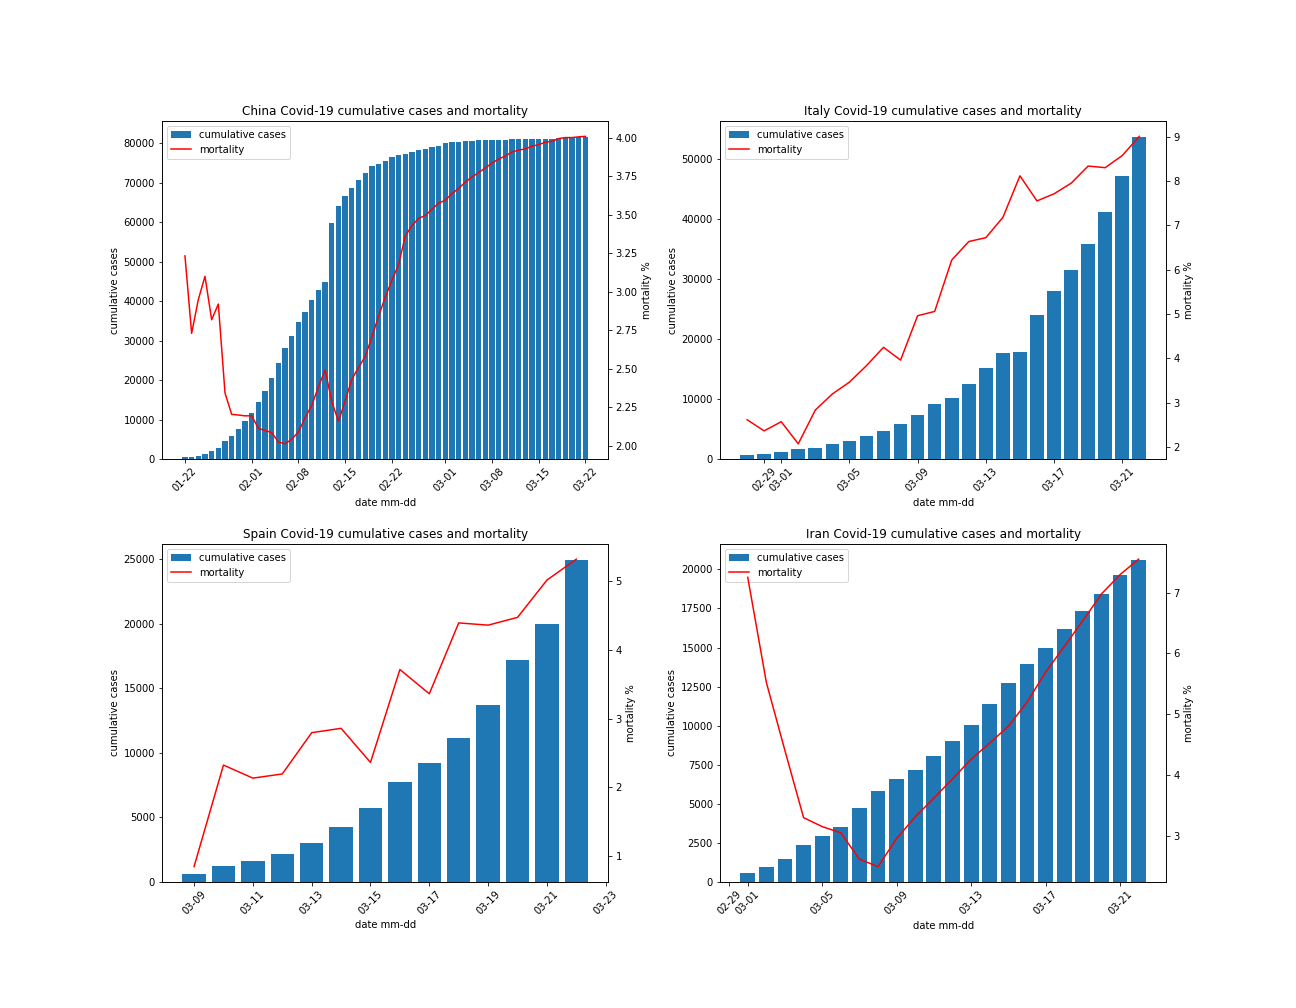
- China moved from 2% to 4%
- Spain moved from 1% to 5%
- Italy and Iran moved form 2% to 8-9% range
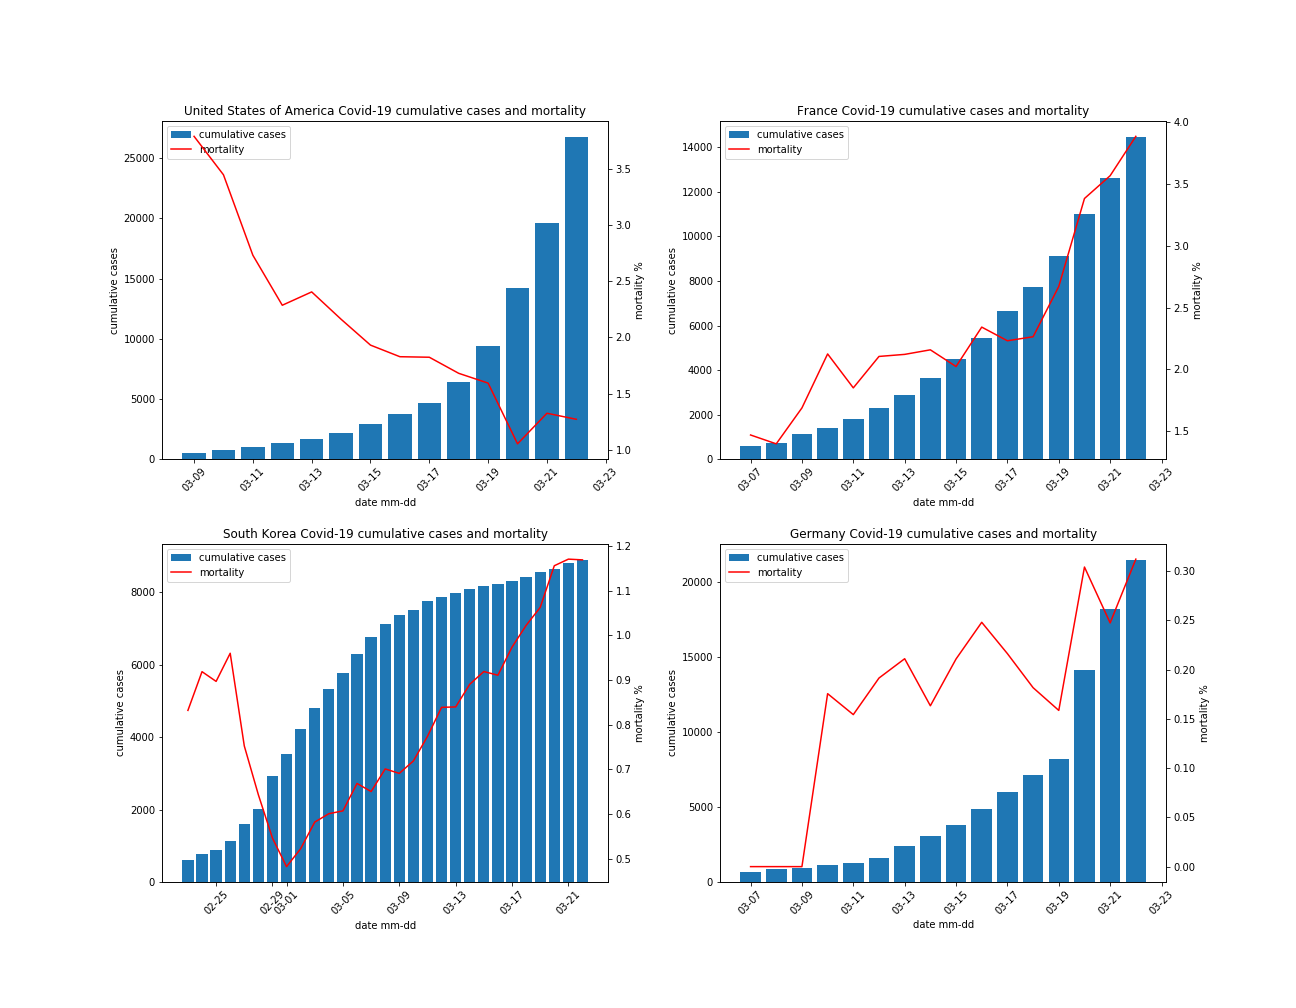
- USA moved down from 3.5% to 1.3%
- France moved up from 1.5% to 4% range
- South Korea moved from .5% to 1.2% range
- Germany stays below 0.3% and it has 20 thousands cases detected, this is 1/3 of Italy volume
Germany case suggests actual Covid-19 mortality may be much lower than data from other countries suggest. Let’s compare mortality rates on a single chart. I’ve seen data suggesting Germany tested over 250 thousands people for Covid-19.
Mortality comparison for selected countries
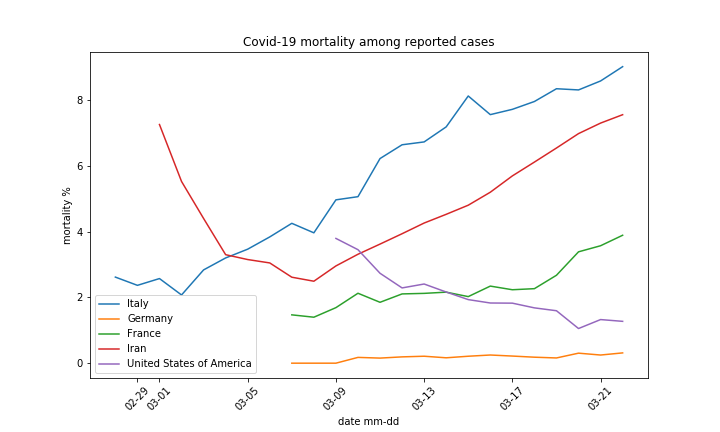
We see a wide difference in mortality rate among detected cases. Italy is at 9% level, while Germany at 0.3% level. This represents a factor of 30 difference. I attribute this difference to the scale of testing. Germany tests cover much broader population, while Italy focuses testing on severe cases. In result true number of Covid-19 cases is under reported in Italy thus pushing mortality rate up. I’ll move further discussion of Covid-19 mortality to another post.