Death is definitive. We are in Lent period, approaching Passion Week, resurrection promise is important for some of you. However for Covid-19 impact measurement purposes death is definitive enough. Number of infection cases can be under estimated, especially if there is no proper test coverage of entire population. Cases not producing symptoms or producing light/moderate symptoms are likely to stay under radar. Death cases are investigated thoroughly, every Covid-19 infection is likely to be discovered in post-mortem. We can use population mortality rate as a measure of Covid-19 epidemic development. We will name it Covidmeter for brevity. Let us present how it links with data.
High and low mortality countries update
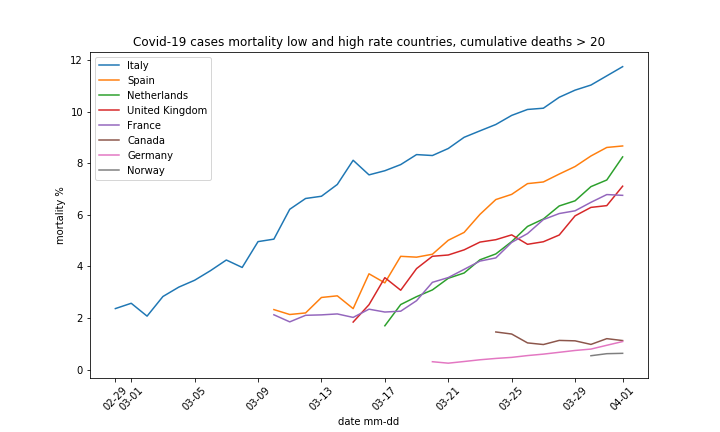
Chart below displays mortality rate evolution. It has been discussed here under “Cases mortality rate evolution” heading. As we can see United Kingdom replaced Iran in top 5 cases mortality rate, overtook France and is now number 4. Italy rate passed 11.7% and since mid March has been growing at constant pace. On the low end side Norway exceeded 20 deaths and mad to the chart. Germany rate now exceeds 1%.
Italy Covid-19 deaths and mortality rate
Chart below shows daily deaths (left axis) and cases mortality (right axis) for Italy. It also presents a moving average for daily deaths on left axis.
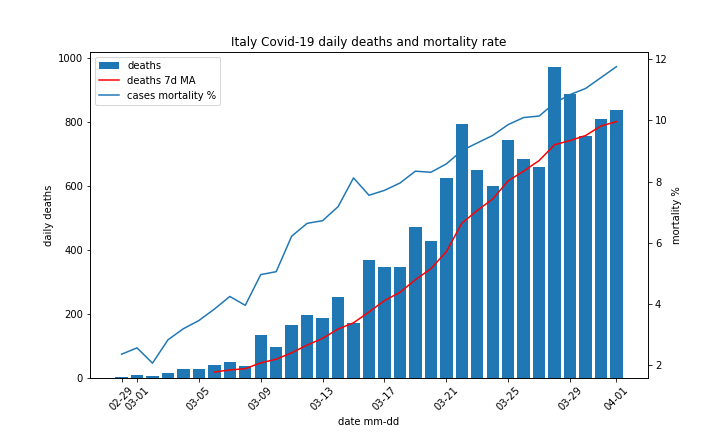
So far daily deaths stayed above 7 day moving average, so the latter was growing. Recently daily deaths count growth seems to slow down. We can see red MA curve is flattening, however it too early to draw definitive conclusion.
Italy true number of Covid-19 cases
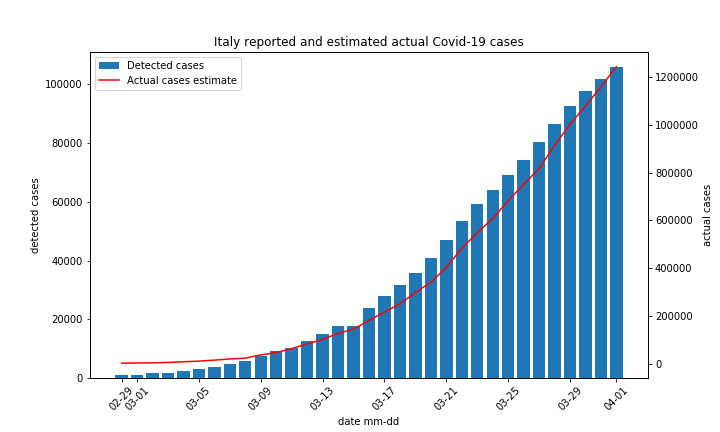
Drawing below shows cumulative number of Covid-19 cases detected in Italy (bars, left axis). Since no detection method is perfect, we challenge it with estimate of actual figure (red line, right axis). Please note according to out estimate 1.2 million cases is 12 times higher than detected number – 100 thousands or 0.1 million. Below we explain how estimate is calculated and why high number of cases can be a good.
Estimating actual number of Covid-19 cases
We calculate an estimated number of cases using reported deaths and Diamod Princess mortality data as described here under “Hope from numbers” section. If Covid-19 virus is the same on Diamond Princess and Italy it should give similar impact on population. It is very contagious, 20% of population gets infected, but not very lethal with 0.2% fatalities. Fatalities typically have other acute illness or are of older age, thus have higher demise probability even without Covid-19 infection. On Diamond Princess there were 3700 passengers and crew, 700 detected cases and 7 deaths. This gives 1% cases mortality figure. We use it to estimate Italy cases shown above dividing cumulative number of deaths by 0.01 (1%).
Cases under reporting scenario is a positive one. If true mortality rate for cases is close to 12% and number of detected cases continues to grow as it does in Italy, one should seriously consider writing a will. Under reporting scenario of scale such as in Italy is relatively easy to confirm. With 1.2 million and 60 million population we have 2% penetration rate. It should be straightforward to discover with simple statistical sample test. Actually infection rate is not uniform across Italy, it is probably much higher in northern part, where the epidemic started. Consequently we should use more granular approach, take death cases and population from region and calculate penetration locally not at country level. Unfortunately I have no such data. This makes a closer look at San Marino even more tempting.
Covidmeter introduction
We calculate population mortality dividing reported cumulative deaths by population count. Top three population mortality countries/regions reported in ECDC data are:
- Diamond Princess
- San Marino
- Italy
San Marino in case you don’t remember is an enclave in the middle of Italy. It may be interesting to investigate it separately, but let’s focus on Italy first. Chart below show population morality rate for Italy. Diamond Princess figure 0.2% is drawn as reference.
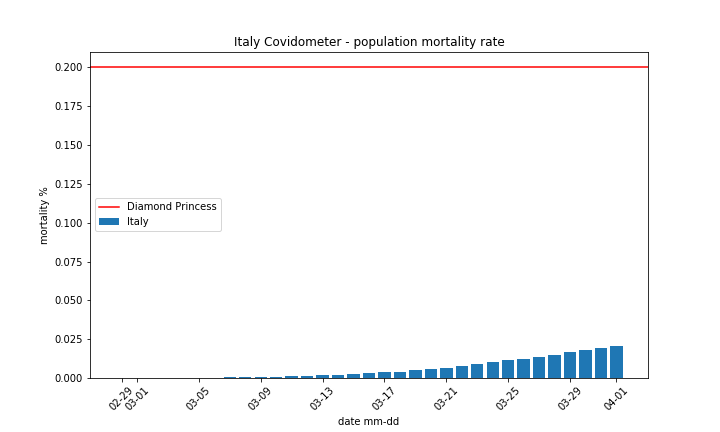
We see Italy is well below Diamond Princess line. Please note we use pure data here: Number of deaths divided by population. Both numerator and denominator are measured. The above chart allows for easy monitoring of Covid-19 development and population impact, that’s why it was named Covidmeter.