Let’s have a closer look at Covid-19 mortality rate. We focus on mortality among detected cases, since population fraction affected is still very tiny. Mortality rate defined as quotient of cumulative death cases and cumulative detected cases can vary between 0.3% and 11%, a factor of 30 difference. Quite a significant difference indeed.
Data in table below below come from 2020-03-30 ECDC set, columns are explained below the table. As predicted in my previous post USA took the top spot in number of Covid-19 cases, China is now number 3, Spain will likely displace it on March 31st. Please note China started to report new cases albeit number is low (121).
| DateRep | CountrY | Cases | Deaths | CCases | CDeaths | Mort% | pop2018 | |
|---|---|---|---|---|---|---|---|---|
| 0 | 2020-03-30 | United States of America | 18360 | 318 | 143025 | 2509 | 1.75 | 327167434 |
| 1 | 2020-03-30 | Italy | 5217 | 758 | 97689 | 10781 | 11.04 | 60431283 |
| 2 | 2020-03-30 | China | 121 | 5 | 82463 | 3311 | 4.02 | 1392730000 |
| 3 | 2020-03-30 | Spain | 6549 | 838 | 78797 | 6528 | 8.28 | 46723749 |
| 4 | 2020-03-30 | Germany | 4751 | 66 | 57298 | 455 | 0.79 | 82927922 |
| 5 | 2020-03-30 | France | 2599 | 292 | 40174 | 2606 | 6.49 | 66987244 |
| 6 | 2020-03-30 | Iran | 2901 | 123 | 38309 | 2640 | 6.89 | 81800269 |
| 7 | 2020-03-30 | United Kingdom | 2433 | 209 | 19522 | 1228 | 6.29 | 66488991 |
| 8 | 2020-03-30 | Switzerland | 1122 | 22 | 14274 | 257 | 1.80 | 8516543 |
| 9 | 2020-03-30 | Netherlands | 1104 | 132 | 10866 | 771 | 7.10 | 17231017 |
| 10 | 2020-03-30 | Belgium | 1702 | 78 | 10836 | 431 | 3.98 | 11422068 |
| 11 | 2020-03-30 | South Korea | 78 | 6 | 9661 | 158 | 1.64 | 51635256 |
| 12 | 2020-03-30 | Turkey | 1815 | 23 | 9217 | 131 | 1.42 | 82319724 |
| 13 | 2020-03-30 | Austria | 522 | 18 | 8813 | 86 | 0.98 | 8847037 |
| 14 | 2020-03-30 | Canada | 869 | 1 | 6255 | 61 | 0.98 | 37058856 |
| 15 | 2020-03-30 | Portugal | 792 | 19 | 5962 | 119 | 2.00 | 10281762 |
| 16 | 2020-03-30 | Brazil | 352 | 22 | 4256 | 136 | 3.20 | 209469333 |
| 17 | 2020-03-30 | Israel | 628 | 3 | 4247 | 15 | 0.35 | 8883800 |
| 18 | 2020-03-30 | Norway | 257 | 2 | 4102 | 22 | 0.54 | 5314336 |
| 19 | 2020-03-30 | Australia | 284 | 2 | 4093 | 16 | 0.39 | 24992369 |
Table columns are explained below
- CASES, DEATHS – cases and deaths at reporting date (column DATEREP)
- CCASES, CDEATHS – cumulative cases and deaths
- MORT% – cumulative cases mortality rate CCCASES/CDEATHS in percentage points
- POP2018 – country population in 2018
Table below shows how top20 countries compare with entire world.
| top 20 | world | top % | |
|---|---|---|---|
| Cumulative cases | 649859 | 715669 | 90.8 |
| Cumulative Deaths | 32261 | 33574 | 96.1 |
| population 2018 | 2601228993 | 7459101652 | 34.9 |
| count | 20 | 196 | 10.2 |
As we see top 20 countries cover 91% of Covid-19 cases detected worldwide and account for 96% deaths. Similar comparison for top 5 countries below:
| top | world | top % | |
|---|---|---|---|
| CumCases | 459272 | 715669 | 64.2 |
| CumDeaths | 23584 | 33574 | 70.2 |
| pop2018 | 1909980388 | 7459101652 | 25.6 |
| count | 5 | 196 | 2.6 |
From table above we see Top 5 countries: had 459272 cases 23584 deaths in total, for population of 1909980388, close to 2 billion (US, 10E9). Of course China contributes more than half of the latter number. Let’s calculate some rations for top 5 countries:
- cases/population 0.024%
- deaths/population 0.0012%
- deaths/cases 5.14%
First two numbers are distorted by China huge population count. Covid-19 outbreak in China is officially declared contained, other countries are in full swing. Last number is both concerning and interesting because there are countries with high and low mortality rates. Lets have a look at them. From top 20 countries we have selected 5 with lowest and 5 with highest mortality rate. Data are presented below sorted on cases mortality in highest to lowest order.
Low and high cases mortality countries
Table below show low case mortality countries selected form top 20 table:
| DateRep | Countries | Cases | Deaths | CCases | CDeaths | mort% | |
|---|---|---|---|---|---|---|---|
| 14 | 2020-03-30 | Canada | 869 | 1 | 6255 | 61 | 0.98 |
| 4 | 2020-03-30 | Germany | 4751 | 66 | 57298 | 455 | 0.79 |
| 18 | 2020-03-30 | Norway | 257 | 2 | 4102 | 22 | 0.54 |
| 19 | 2020-03-30 | Australia | 284 | 2 | 4093 | 16 | 0.39 |
| 17 | 2020-03-30 | Israel | 628 | 3 | 4247 | 15 | 0.35 |
High mortality countries follow
| DateRep | Countries | Cases | Deaths | cCases | CDeaths | Mort% | |
|---|---|---|---|---|---|---|---|
| 1 | 2020-03-30 | Italy | 5217 | 758 | 97689 | 10781 | 11.04 |
| 3 | 2020-03-30 | Spain | 6549 | 838 | 78797 | 6528 | 8.28 |
| 9 | 2020-03-30 | Netherlands | 1104 | 132 | 10866 | 771 | 7.10 |
| 6 | 2020-03-30 | Iran | 2901 | 123 | 38309 | 2640 | 6.89 |
| 5 | 2020-03-30 | France | 2599 | 292 | 40174 | 2606 | 6.49 |
As we can see there is a wide difference in case mortality rate, it range s form 11.04% for Italy to 0.35% for Israel. You can argue Israel is in early development, but Germany has mortality rate at 0.79% and it has 57 thousands cases which is comparable with mortality record beating Italy 97 thousands cases. Italy and Germany are very similar countries in terms of size, population, wealth, economic development. I see no other explanation for order of magnitude mortality rate difference other than Covid-19 testing approach, discussed in previous post. Let’s have a look at mortality rate evolution over time.
Cases mortality rate evolution
We show picture for low cases mortality countries first. Data are shown as soon as cumulative deaths exceed 5. This eliminates initial fluctuations.
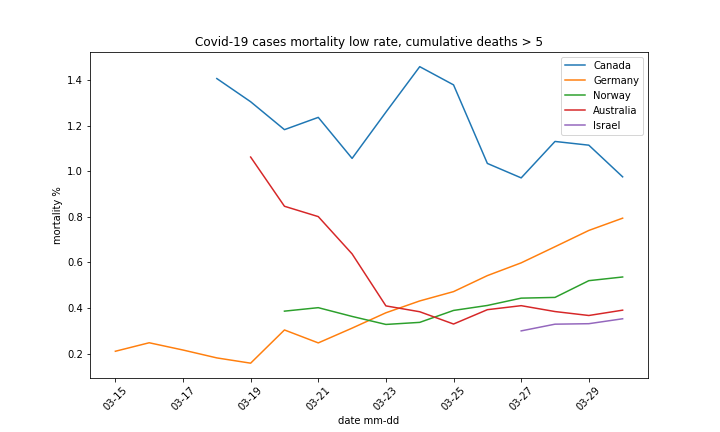
Please note Germany started with mortality rate around 0.2% of detected cases and its stayed at that level quite long. I believe the rate started to climb once growing number of cases made test diverted from general application to heavier cases. This is positive scenario.
For high mortality rate countries we show data once cumulative death cases exceed 20. Again this eliminate early fluctuations. Iran was an extreme example here, initial number of deaths equaled number of cases. Iran example shows how testing influences detected cases mortality rate.
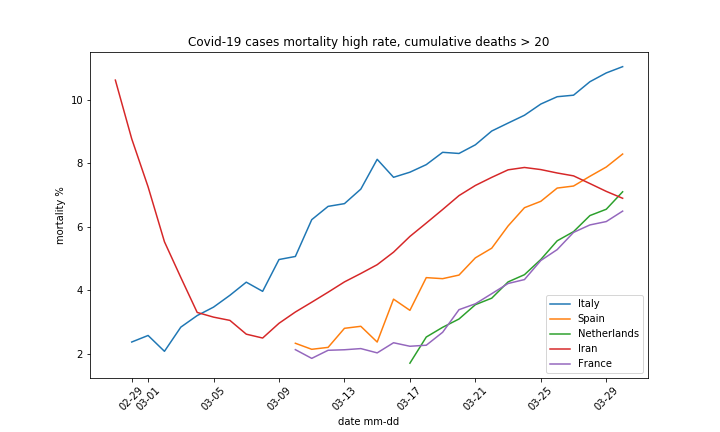
One more comment on Iran curve. Is started very high, dropped to 2% range, then climbed back in a almost Italian fashion (favorite explanation lack of test of course). Recently we see Iran detected case mortality heading down. Iran rate is going better than for other high mortality countries. Does a poor Iran has a more reasonable approach to disease handling than wealthy European countries? They may have less means but doe to recent turbulent history has much more experience in handling emergency situations, thus better allocation of its limited resources.
Figure below shows low and high rate countries combined. Some low rate countries don’t qualify since 20 cumulative deaths threshold is applied.
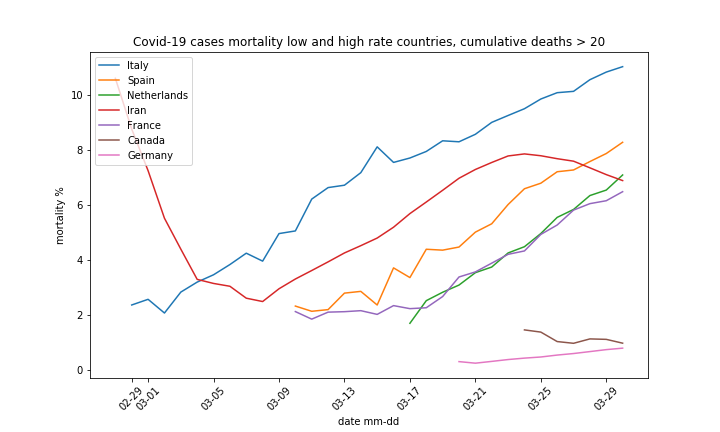
It extremely important to understand cases mortality difference between Germany and high rate countries. It would allow us to estimate actual Covid-19 impact on population.
Final remarks
I write a lot about importance of broad population testing. I believe difference in cases mortality rate comes from distortion of cases detection process in high mortality countries. Tests are scarce and used on heavier cases, more likely to end as fatalities, thus mortality rate goes up. I try to get a reliable data on number of tests performed in countries, but no success so far. I have contacted ECDC (European Centre for Disease Prevention and Control) my primary source, but thy have no such data data available. I see no other way to estimate true number of Covid-19 cases in population than a test on a random sample coming from actual population distribution. This process has to be separate from testing patients showing clear Covid-19 symptoms. If anyone knows where to find a reliable data on number of tests performed in countries I’d appreciate if you share it.