Elektrownia jądrowa – koszt energii

Budowana w Wielkiej Brytanii elektrownia atomowa ma 6 lat opóźnienia. Jej obecnie szacowany koszt przekracza trzykrotnie oryginalnie planowany bużet.

W Polsce elektrowni jądrowych nie ma, są dumne plany ich budowy. Można wspomnieć wizje rządu z roku 2010, kiedy spółka PGEEJ1 obiecywała uruchomić pierwszy reaktor energetyczny w roku 2022. Wtedy oceniano koszty budowy na 1-2 miliony EUR na MW mocy. Od tego czasu ceny wzrosły i to bardzo.

Elektrownie jądrowe buduje się w innych krajach. Weźmy na przykład projekt z UK Hinkley Point C. Faktyczna budowa zaczęła się 2017, miała trwać 8 lat. Obecnie przewiduje się zakończenie w 2029-31co daje 4-6 lat opóźnienia. Przewidywany koszt wzrósł z 18 do 48 miliardów GBP. Przy planowanej mocy 3200 MW daje to 15 milionów GBP za 1MW zainstalowanej mocy elektrycznej. Elektrowni jeszcze nie ma ale wiadomo na ile wyceniono energię, którą będzie produkować: 92.50 GBP za MWh z prawem do indeksacji o inflację. Na rok 2022 wartość po indeksacji wynosi 128 GBP/MWh. Cena energii jest gwarantowana przez rządowy kontrakt, dzięki czemu można finansować projekt. Wykorzystywany jest mechanizm kontraktu na różnicę (CFD) obowiązującego przez 35 lat.

Spójrzmy na stronę finansową przedsięwzięcia. Przyjmijmy, że elektrownia będzie pracować z pełną mocą przez 7000 godzin w roku. Jest to pewne uproszczenie, ale pamiętajmy, że rok ma 8760 godzin, instalacja potrzebuje planowanych przestojów na remonty, nie zawsze pracuje z pełną mocą. Przyjmijmy dalej, że początkowa inwestycja ma zwrócić się w 35 lat a koszt pięniądza to 4% w skali roku.

  • 1.43 e9 (miliardów) GBP raty kapitałowej (50/35)
  • 2 e9 GBP odsetek (4e-2*50) w pierwszym roku
  • 153.1 GBP/MWh samych kosztów finansowych (3.43e9/3200/7000)

Przyjmując indeksację ceny energii elektrycznej o 2% inflacji rocznie przez 8 lat mamy

  • 150 GBP/MWh cena gwarantowana energii w pierwszym roku pracy elektrowni po indeksacji o inflację (1.02**8 * 128)

Gwarantowana cena energii w pierwszym roku działania nie zwraca kosztów finansowania projektu, o innych kosztach operacyjnych (a te na pewno występują) nie wspominamy. Oczywiście elektrownia ma działać 60 lat, więc jeżeli jest się własnością rządu jak EDF, można uchwalić finansowanie się z przyszłych zysków. Oczywiście kalkulacje powyższe są uproszczone, ale dla EDF budowa tej elektrowni to kiepski interes. Trudno oczekiwać innego rezultatu kiedy koszty projektu przekraczają trzykrotnie początkowy budżet.

Ile ma kosztować pierwsza elektrownia jądrowa w Polsce i na jakich warunkach finansowych będzie budowana nie wiem. Nie wiem jak będą dzielone ryzyka projektu z wykonawcą. To ostatnie jest bardzo istotne, bo koszty finalne projektu mogą znacznie przekroczyć początkowe oszacowania. Możemy przeliczyć na PLN gwarantowaną cenę energii z projektu wyspiarzy.

  • 640 PLN/MWh odpowiada obecnej (2022) cenie gwarantowanej energii z Hinkley Point 128 GBP * 5 (obecny kurs to 5.17)

Rząd walczy o utrzymanie ceny dla odbiorców indywidualnych poniżej 500 PLN/MWh. Energia jądrowa może nie dać wsparcia w tym boju.
Energia elektryczna z gazu

Spalanie jednej tony metanu daje 7.64 MWh energii elektrycznej i 2.75 tony CO2. W przybliżeniu produkcja 1MWh energii elektrycznej wymaga spalenia 2MWh gazu TTF i emisji 0.4 tony CO2.

Jaki jest uproszczony koszt energii elektrycznej produkowanej z gazu ziemnego? Ignorując wszystkie koszty związane z inwestycją w instalację do wytwarzania i jej utrzymaniem, a to nie ą tanie rzeczy, zostaje nam koszt paliwa, gazu z którego pochodzi energia przetwarzana na prąd i skutków jego spalania. Obecnie najwydajniejszymi instalacjami do produkcji energii elektrycznej z gazu są elektrownie CCGT. Nośnikiem energii w gazie ziemnym jest metan (CH4), inne gazy to zanieczyszczenia. Dalej przyjmujemy, że gaz ziemny to czysty metan.

  • 35.8 MJ/m3 to wartość opałowa 1m3 metanu w warunkach normalnych
  • 0.717 kg/m3 gęstość metanu w warunkach normalnych
  • 49.9 MJ/kg energia uzyskiwana ze spalenia 1kg metanu

Produktami spalania metanu są dwutlenek węgla i woda. Podawane są dwie wartości kaloryczne metanu wyższa 39.8 MJ/m3 i niższa of 35.8MJ/m3. Niższa wartość dotyczy procesu, kiedy produktem spalania jest para wodna. Jej skroplenie jest źródłem dodatkowej energii dającej wyższą wartość kaloryczną.

Energię elektryczną zwyczajowo mierzymy w watogodzinach (Wh) i ich wielokrotnościach tysiącach (kWh) lub milionach (MWh).

  • 1 kWh to 3.6 MJ (1000W x 3600s)
  • 13.9 kWh to wartość energetyczna 1kg metanu (49.9/3.6)

Oczywiście blok energetyczny tylko część energii zawartej w gazie przekształca w energię elektryczną. Sprawność bloku CCGT jest w przedziale 50-60 procent, dla dalszych rozważań przyjmiemy 55%.

  • 7.64 kWh energii elektrycznej powstanie w wyniku spalenia 1kg metanu (13.9*0.55)

Produktem spalania metanu jest dwutlenek węgla i woda (CH4+2O2->CO2+2H2O). W UE obowiązuje system ETS (Emissions Trading System, EU ETS), który wprowadza opłaty za emisję CO2. Masa atomowa węgla wynosi 12u, wodoru 1u, co daje 16u masy atomowej cząsteczki metanu. Masa atomowa tlenu wynosi 16u, zatem masa atomowa cząsteczki CO2 to 44u. Powstały w wyniku spalania dwutlenek węgla jest 44/16=2.75 raza cięższy od spalonego metanu.

  • 2.75 kg CO2 powstaje w wyniku spalenia 1 kg metanu

Koszt gazu ziemnego zależy od jego ceny rynkowej. Rynek gazu jest skomplikowany, przyjmujemy, że cenę rynkową pokazuje Holenderski TTF. Cena podawana jest w EUR za MWh, przy czym cenę energii gazu podaje się na podstawie wyższej wartości kalorycznej (High Heating Value), co można postrzegać jako drobną manipulację, zawyżenie wartości opłowej. Dla naszych rozważań potrzebujemy ceny 1kg metanu

  • 0.04 EUR/kWh cena gazu TTF w 2024 była w przedziale 23-49 EUR/MWh
  • 1.1 wynosi stosunek wyższej do niższej wartości kalorycznej (39.8/35.8)
  • 15.3 kWh gazu trzeba zakupić na TTF żeby uzyskać 1kg metanu (13.9*1.1)
  • 2.63 PLN cena 1kg metanu (0.04 * 15.3 * 4.3) kurs EUR/PLN 4.3

Cena uprawnień emisji CO2 jest wyznaczana na rynku, w roku 2024 wynosiła od 50 do 80 EUR za tonę. Przyjmujemy, że średnia cena zakupy uprawnień przez elektrownię wynosiła 60 EUR za tonę. Wreszcie mamy podsumowanie kosztów produkcji energii elektrycznej z gazu.

  • 2630 PLN tona metanu (z gazu ziemnego)
  • 710 PLN (60 EUR * 4.3 EUR/PLN * 2.75) uprawnienia do emisji 2.75 tony CO2
  • 7.64 MWh wytworzonej energii elektrycznej
  • 437 PLN (2630+710)/7.64 to koszt paliwa do wytworzenia 1 MWh energii elektrycznej. W rozbiciu na składniki 344 (gaz) + 93 (uprawnienia)
  • 2 MWh gazu TTF i uprawnienia do emisji 0.36t CO2 (15.3/7.64 gaz, 2.75/7.64 uprawnienia) trzeba zakupić do wygenerowania 1MWh energii elektrycznej

Podobna kalkulacja dla elektrowni węglowej daje 657 PLN kosztu paliwa i uprawnień do produkcji 1 MWh energii elektrycznej. Warto zauważyć, że cena paliwa jest porównywalna, ale emisja CO2 na wytworzoną jednostkę energii przy spalaniu węgla jest trzykrotnie wyższa niż w przypadku gazu, co daje trzykrotnie wyższy koszt uprawnień. Oczywiście ceny gazu potrafią zmieniać się jeszcze bardziej niż ceny węgla, zwłaszcza jeżeli skutkiem wojny zastępuje się tańszy gaz droższym. Elektrownie gazowe mają istotną przewagę nad węglowymi: można je szybciej uruchomić i szybciej wyłączyć. Ma znaczenie dla kompensacji zmian mocy źródeł odnawialnych.

Energia elektryczna z węgla

Spalanie jednej tony węgla daje 3.24 MWh energii elektrycznej i 3.66 tony CO2.

Jaki jest uproszczony koszt energii elektrycznej produkowanej z węgla? Ignorując wszystkie koszty związane z inwestycją w instalację do wytwarzania i jej utrzymaniem, a to nie ą tanie rzeczy, zostaje nam koszt paliwa, węgla z którego pochodzi energia przetwarzana na prąd i skutków jego spalania. Nośnikiem energii węgla kamiennego jest pierwiastek węgiel (C), reszta (kilka %) to zanieczyszczenia.

  • 29.3 MJ/kg wartość energetyczna węgla

Energię elektryczną mierzymy w watogodzinach (Wh) i ich wielokrotnościach tysiącach (kWh) lub milionach (MWh)

  • 1 kWh to 3.6 MJ (1000W x 3600s)
  • 8.1 kWh to wartość energetyczna 1kg węgla kamiennego (29.3 / 3.6)

Oczywiście blok energetyczny tylko część energii zawartej w węglu przekształca w energię elektryczną. Przyjmując, że nowoczesny blok węglowy ma sprawność 40% mamy:

  • 3.24 kWh energii elektrycznej powstaje ze spalenia 1kg węgla w elektrowni (0.4*8.1)

Produktem spalania węgla jest dwutlenek węgla (CO2), co ma istotne znaczenie albowiem w UE obowiązuje system ETS (Emissions Trading System, EU ETS), który wprowadza opłaty za emisję tego gazu. Masa atomowa węgla wynosi 12u, tlenu 16u, zatem masa atomowa cząsteczki CO2 to 44u. Powstała w wyniku spalania cząsteczka CO2 jest 44/12=3.66 raza cięższa niż spalony węgiel.

  • 3.66 kg CO2 powstaje w wyniku spalenia 1kg węgla

Koszt węgla zależy od jego ceny rynkowej, która podlega wahaniom. Pamiętamy rok 2022 kiedy ceny węgla opałowego przekraczały 3000 złotych za tonę (1000kg) a towaru na składach brakowało. Obecnie węgiel opałowy sprzedawany jest w cenie od 1200 PLN i przyjmuję, że taką cenę płacą też elektrownie. Cena uprawnień emisji CO2 jest wyznaczana na rynku, w roku 2024 wynosiła od 50 do 80 EUR za tonę. Przyjmujemy, że średnia cena zakupy uprawnień przez elektrownię wynosiła 60 EUR za tonę

  • 1200 PLN tona węgla
  • 930 PLN (60 EUR * 4.3 EUR/PLN * 3.66) uprawnienia do emisji 3.66 tony CO2
  • 3.24 MWh wytworzonej energii elektrycznej
  • 657 PLN/MWh (1200+930)/3.24 koszt paliwa do wytworzenia 1 MWh energii elektrycznej. W rozbiciu na składniki 370 (węgiel) + 287 (uprawnienia)

Cena energii elektrycznej jest także ustalana na rynku, w Polsce jest to TGE. Oczywiście cena zmienia się w czasie, w momencie tworzenia tego wpisu (2024.12.07) jest to około 500 PLN za MWh, co daje 150 PLN więcej niż koszt wyliczony wyżej. Dlaczego utrzymuje się elektrownie, których produkt (teoretycznie) nie wystarcza na pokrycie kosztów zakupu i spalenia paliwa to pytanie do właściciela. Rozliczenia są znacznie bardziej skomplikowane, niż prezentowana kalkulacja kosztów paliwa i emisji CO2. Narzekanie na ETS jest bezproduktywne, możemy się go pozbyć korzystając z Artykuł 50 Traktatu o Unii Europejskiej. Rządowi zamiatanie pod dywan problemu ułatwia fakt, że ETS to de facto podatek, wypływy zasilają kasę państwa, na którego terenie działa źródło CO2.

War impact on natural gas market in US and EU

Natural gas market price in European Union and USA is different for a reason. EU has limited deposits and imports substantial amounts of natural gas, while US has vast resources and was the largest liquefied natural gas (LNG) exporter in 2023. Gas trading ecosystem is complicated there are many bilateral agreements with undisclosed price terms. However both US and EU have gas trading hubs with both spot and futures market prices publicly quoted, they often serve as benchmark to other contracts. In this article we compare Henry Hub (US) and TTF (EU, Netherlands) natural gas prices and how Ukraine war impacted them.

Gas price change over time

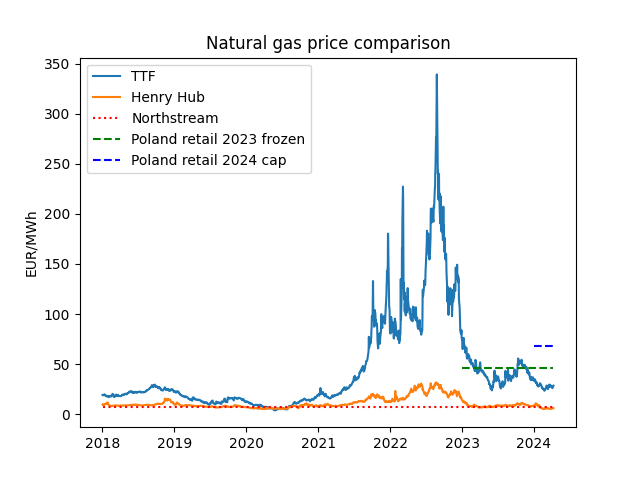
Data used for comparison come from Yahoo via Python API. I can share Jupyter notebook used to make figures, just let me know. Henry Hub quotes gas in USD/MMBTU (million British thermal units) while TTF uses EUR/MWh (1 MWh = 3.4121 MMBTU). Besides HH and TTF prices figure below shows North Stream gas price and retail price in Poland set by regulator.

North Stream was a direct connection between Russian and German systems. Gas price was set by bilateral contract, details are unknown. I’ve heard a rumour the price was set to 82 EUR/1000m3, which seemed too low to be true. What is true is 84.9m3 of natural gas represents 1MWh. North Stream gas (alleged) gas price converted to EUR/MWh was marked on figure below. As we can see Henry Hub price in peacetime is compatible. Each fairy tale has grains of truth.

Retail “frozen price” was set by market regulator in Poland to shield customers from wild raise of market gas price. Gas distribution company (state owned PGNiG) was compensated for retail losses. However protection system was not set for commercial customers, who experienced 10x or so price hike. I remember discussion with sport club owner who was forced to switch off tennis courts heating and cancel classes for children because of gas cost. As we can see frozen price is slightly above average TTF gas price in 2023. Of course 2022 was another story.

Frozen gas price is in force till mid 2024, once it expires gas price cap set by regulator will be in place. The cap is 50% higher than frozen price and more than double current TTF price.

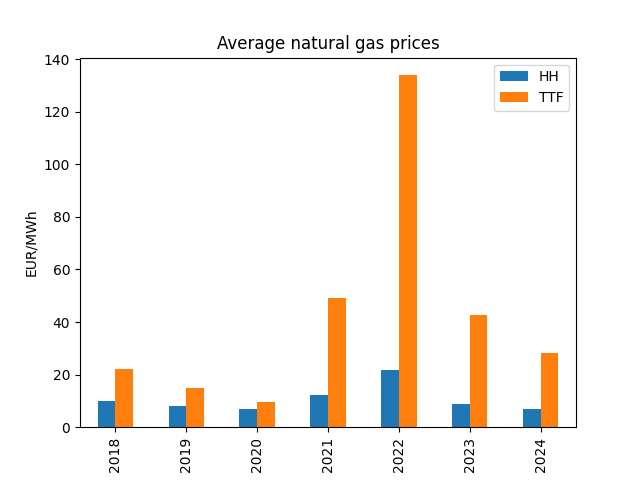
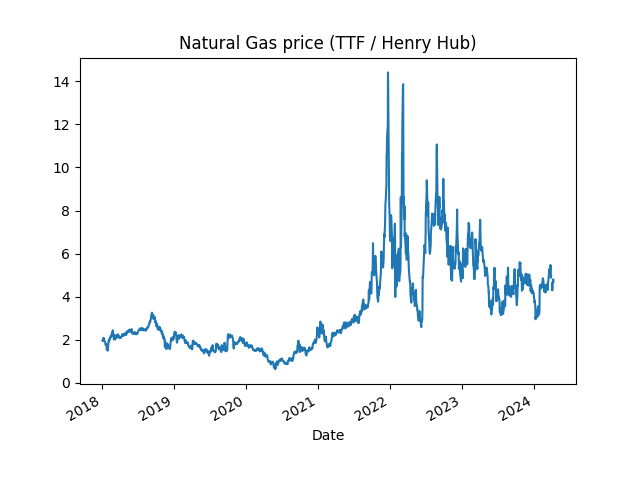
Historically TTF gas price was above Henry Hub. Gap closing in 2020 took place during COVID-19 outbreak and widespread lock-downs resulting in demand drop. Briefly TTF gas price was even below Henry Hub, but 2020 is a very special case. In 2021 price gap widened, maybe gas prices were predicting Ukraine war? War outbreak in 2022 resulted in wild gas price rise in EU. It is not surprising since more than 50% of gas was imported form Russia and this source was abruptly cut. At some point TTF gas was 14 times more expensive then Henry Hub. Situation started to normalize in 2023, difference between markets was still high but at least wild price swings in EU somehow subdued.

Average price comparison

Figure below shows average gas price for Henry Hub and TTF calculated on annual basis. US prices returned to prewar level, while EU stay elevated.

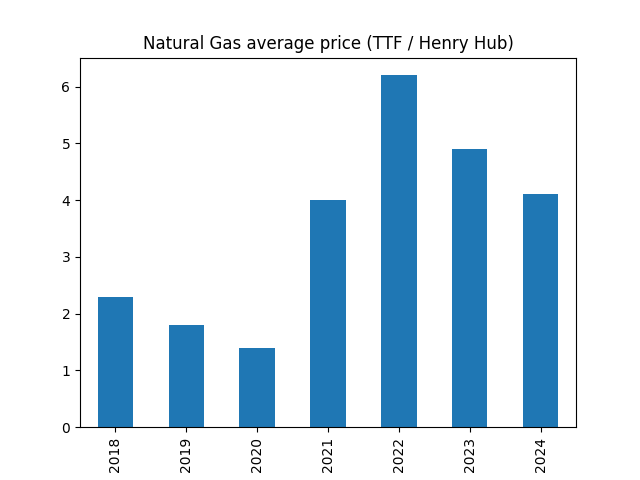
Figure below shows average TTF/HH price ratio. We can say gas in EU before war traded at double US price, first year of war made it 6 times more expensive, now it trades 4 times US price.

War losses

EU countries use over 300 billion (300e9) m3 of natural gas per year, this equals 3.5 billion MWh (3.5e9). Using average gas prices we can estimate monetary impact of price hikes. Assuming prewar price at 20 EUR/MWh we have 110 EUR/MWh extra in 2022 and 20 EUR/MWh in 2023. It gives 385 + 70.0 = 455 billion EUR. High energy cost and volatility pushes manufacturing to leave EU. This affect not only GDP but also defense capabilities, Ukrainian shows it’s hard to fight modern war without industry base.

Why natural gas is expensive in Europe (2022-11-15)

This comment was written back in Nov 2022 and found in draft bin. Current US natural gas price below 1.8$ per MMBTU make 3$ markup in price formula detailed below even more eye-popping. Since then natural gas price dropped but US-EU price gab stays wide.

Linked article somehow explains why natural gas is so expensive in Europe. US supplier sells LNG at price defined by formula: HH_price*1.15+3$, where HH stands for Henry Hub price. Gas is sold on long term (10-15 years) contracts, the buyer is free to resell it at its discretion. HH price is quite volatile, today it stands 7.80 per MMBTU, so we have (7.8*1.15+3)/7.8=1.53, 53% markup but it needs to cover some processing costs like turning gas into liquid. LNG is sailed to Europe where it sells at TTF hub in MWh, 1 MMBtuIT ≈ 0.29 MWh so 3.4 MMBTU gives 1 MWh. So 1MWh of natural gas is sold at 12*3.4=41 USD while in Europe at TTF hub it is quoted 120 EUR – triple the purchase price. No wonder European Commission mulls price cap, but why countries are reluctant to support it? Thea are afraid of another market turbulence. US gas used to be more expensive than Russian, some importers were incurring losses. Situation changed once Russia invaded Ukraine and significant amount of Russian gas disappeared form the market resulting in panic buying at any price. Perfect opportunity for suppliers to recover past loses and make nice profits. But those greedy companies are connected with capital bonds to utilities forced by governments to sell gas at fixed price below purchase cost, my bill states 42EUR per MWh, which by strange coincidence is close to price paid at US ports… Unfortunately gas is in high demand, aggressive price cap can divert US made LNG elsewhere and result in sharp price spike or supply crisis.
https://www.politico.eu/article/cheap-us-gas-cost-fortune-europe-russia-ukraine-energy/

You need to add a widget, row, or prebuilt layout before you’ll see anything here. 🙂

Covidmeter 2020-12-14

Covid-19 2nd wave finally hit San Marino, a long serving estimate of cumulative deaths ceiling. First death of 2nd wave in San Marino occurred 2020-11-19 there were 9 fatalities since, last one reported 13th Dec. For reference 1st wave death toll at San Marino was 42, Douglas Adams fans should recognize importance of this number. ECDC data set issued 14th Dec is the final daily update, from now on they switch to weekly reporting. I liked this source of data despite of its flaws, since it integrated many country sources. I have no idea why they have decided to change established reporting schedule. Updated Covidmeter chart below.

  1. North Macedonia made 4th place and death count is growing quite rapidly. The country has area similar to Belgium and around 2 millions inhabitants.
  2. Poland dashed past Russia and is chasing Sweden, let’s hope it will fail in this particular race.
  3. Russia has adopted Sweden like approach before 2nd wave, there is no lock down, however government advertises high hygiene standards and social distancing. So far this policy is paying off.
  4. Sweden approach works, there are casualties but countries with chaotic lock down policies take higher toll. Of course no lock down makes a nice target for political opposition – you gamble with people lives. However past experience shows the gamble was worth taking. Swedish government is free to use this argument for its defense.

Figure below compares Covid-19 1st wave in Belgium (200 days ago, dotted line) with current figures. As we can see no country made past 1st wave Belgium peak and 2 wave peak seems to have passed.

Netherlands (red line) compared to Belgium (green) had much lower death rate than nearby Belgium. They had lighter lock down policy, as BBC claims face masks were mandated only on 1st of Dec 2020, official policy here. I am not sure if face masks are mandatory outdoors, I was amused masks are not required “while swimming in a swimming pool”. This regulation indicates swimming pools are still open. Dutch experience shows face mask does no magic, however there is a pressure to enforce one so other governments don’t look stupid. In general there is a lack of analysis of what really works and why “compensated” with abundance of pressure to implement restrictions for the sake of public good.

Covid-19 status in Europe and ranking confusions

I it is very tempting to state country X leads in Covid-19 deaths or detected cases since it makes a flashy headline. However for the sake of understanding the situation, one should realize over which period was the ranking calculated and how significant is the difference between leader and others.

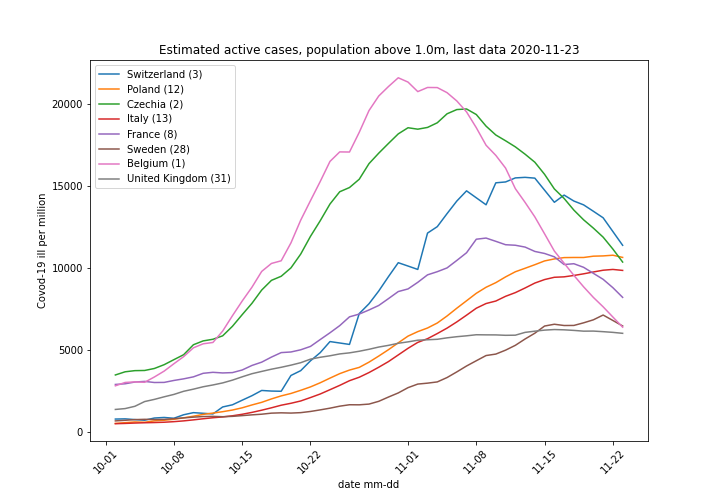
Chart below shows estimated number of Covid-19 ill in selected European countries. I believe true ranking should be build over entire pandemic duration (March 2020 till now, 23.11) using maximum value in this period. This ranking is shown on cart legend after country name. Countries are sorted top down according to latest reading to make country line location easier. Poland is 2nd in group on the day of reading, but only 12 in overall ranking. Poland 10 thousands ill per million is less than 50% of Belgium maximum (22 thousands per million). Belgium passed the peak and is trending down. Poland may have reached the peak, but we need to wait a couple of days to confirm downtrend. Tomorrow we may see Poland with highest number of ill in the group, yet its figure will be lower than today, just Switzerland figure was dropping faster.

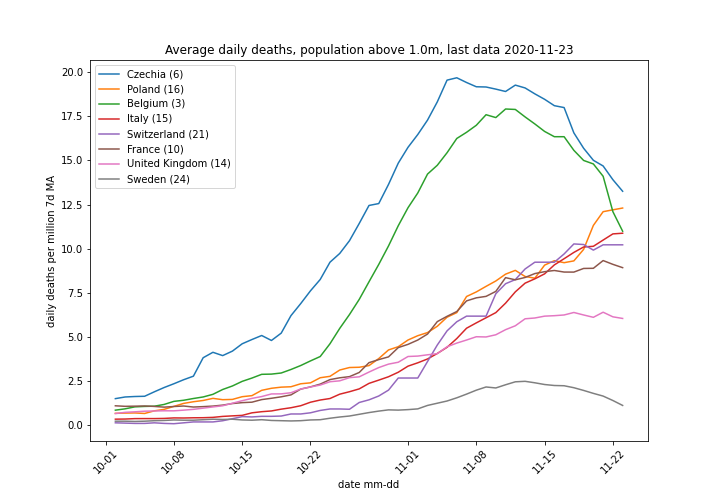
Chart below shows daily deaths 7 days moving average for same country group as above. Averaging eliminates some data noise, countries like Belgium tend to provide preliminary data, they are revised (up) later. Averaging eliminates wild swings between last reading and previous ones. If tomorrow news flashes Poland has most deaths don’t let it deceive you. Currently Czechia, Poland, Belgium, Italy, Switzerland and France have very similar Covid-19 death count.

Conclusions

  1. Don’t focus on single number, look at time evolution and compare with other data.
  2. If somebody tries to convince you situation ins bad in particular country have a look at numbers and compare it with others.
  3. Sweden has neither compulsory mask nor lock down, yet it is doing quite well in above statistics. Some people don’t like Swedish approach and the are quite vocal. If you see another lament on desperate situation in Sweden recall the data and try to guess why the author tries to convince you Sweden is in serious trouble.

Covidmeter 2020-11-15

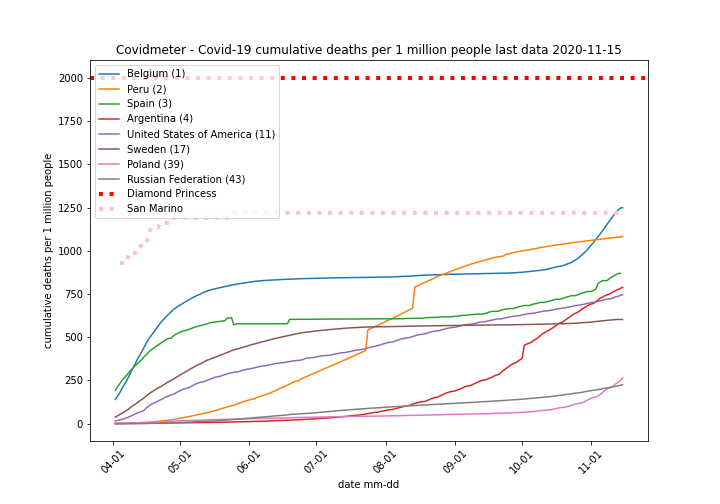
Belgium finally passed San Marino mark in cumulative deaths per million inhabitants. Belgium deaths are higher than other countries. Please keep in mind around 1.2% or 12000 per million people in any developed country with expected life span of 85 years pass away on annual basis. Covid-19 outbreak lasts around 8 months. During that period 9000 (8/12 * 12000) people per million died in Belgium, 1250 had Covid-19 diagnosed. In other words 14% of death count had Covid-19.

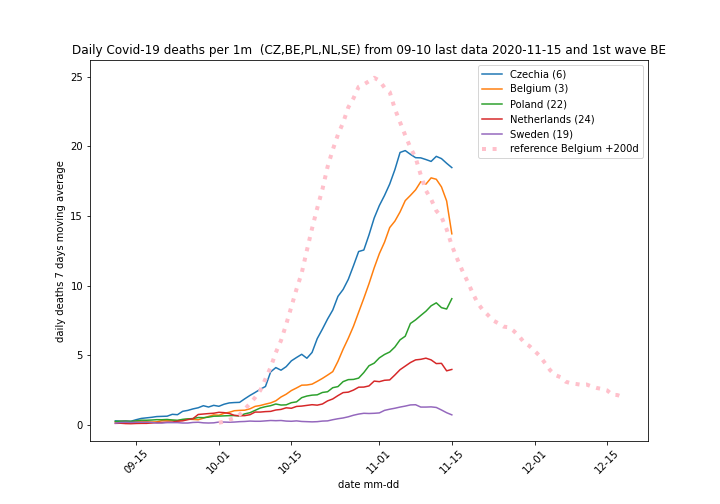
Daily deaths 7 day moving average is now trending down in Belgium and Netherlands. It will probably go down in Czechia as well. On chart below dotted line represents Belgium daily deaths from 1st Covid wave moved forward on time axis by 200 days, we plot it for reference. Solid lines are current data.

Covid-19 cumulative cases and cases mortality evolution

Cumulative Covid-19 cases are growing over time as long as epidemic is active, so does cumulative death count. Cases mortality defined as cumulative deaths to cumulative cases quotient varies over time. In this post we show how it evolved.

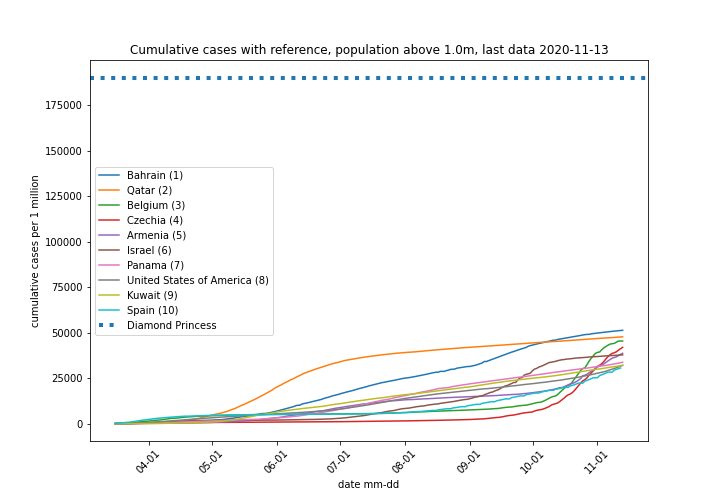
Chart below shows top 10 countries by cumulative Covid-19 cases per million inhabitants. It also shows Diamond Princess (cruise ship hit by Covid-19 at the beginning of pandemic) cumulative cases for reference.

Cumulative cases ranking

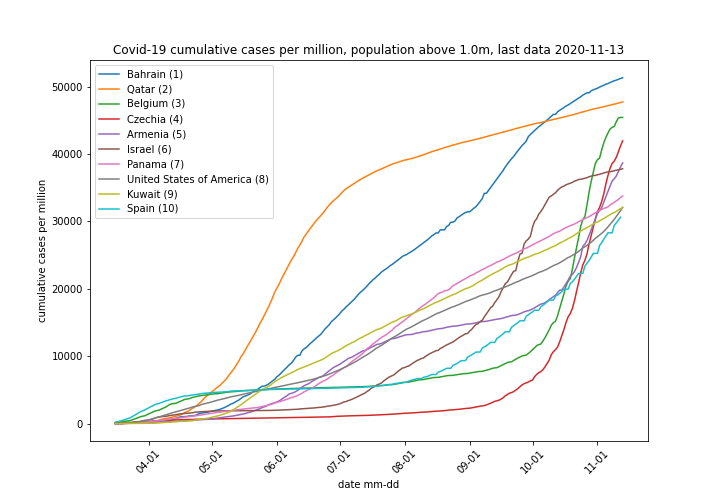
Top 10 countries by cumulative cases per million inhabitants are displayed on chart below, data are the same as above, but removed reference line changes y-axis range. We see leaders in ranking come form Persian Gulf area, they are closely followed by European countries. US (8) has the most cases in absolute numbers. Please note China – the source of problem is not there. They have either managed to eliminate Covid-19 or understood real risk relate to it and quenched media hype around it. I think the latter is true.

Mortality evolution

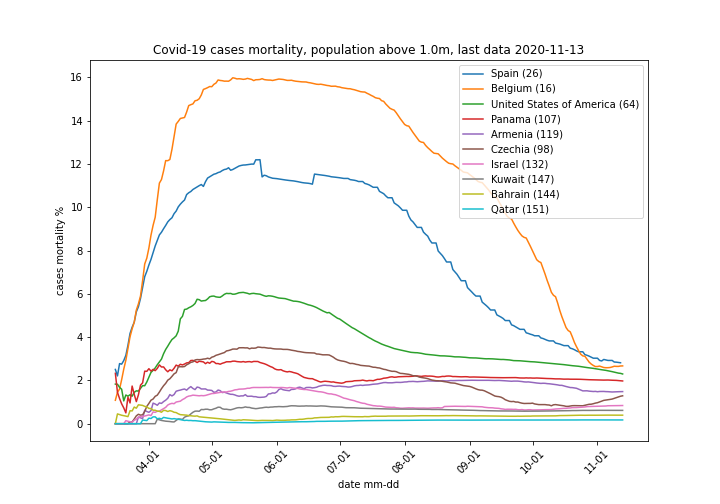
Chart below shows how Covid-19 mortality changed over time. Country list is top 10 by cumulative cases discussed above. Country rank in cases mortality is displayed next to its name. We see leaders of cumulative cases ranking Bahrain, Qatar have very low mortality. This may be due to climate, genetic difference, or just better overall quality of health service including widespread testing from epidemic onset. Please note for Belgium, Spain and US mortality rate dropped with growing number of cumulative cases. The easiest explanation is growth of testing capacity resulting in better detection.

Table below shows country details, Countries are sorted by cases mortality value at latest data point (end of curve). Please note difference between Spain with current (cumulative) cases mortality at 2.8% and Qatar 0.17% is over 10 fold. For comparison Diamond Princess cases mortality was around 1%.

CountryCases Mortality %Cumulative CasesCumulative Deaths
1Spain2.82143722040461
2Belgium2.6752029713891
3United States of America2.3010554801242430
4Panama1.971433522830
5Armenia1.481143831697
6Czechia1.294466755755
7Israel0.843221592706
8Kuwait0.62134932830
9Bahrain0.3984192332
10Qatar0.17135132234

Conclusions

  1. Cases mortality goes down with number of cases detected. This shows high mortality readings are related to poor testing.
  2. Seasonal flue mortality according US CDC is around 0.15%. This is compatible with Covid-19 mortality in Qatar, while US figure is much higher 2.3%. Covid-19 toll may be inflated if all deceased with active Covid and other diseases are attributed to the former. Such an approach is initially prudent, but leads to impact overestimation.
  3. Taking into account impact of Covid on economy and society quality and quantity of data available is far from satisfactory. Those who have relevant data (China?) handle situation much better with more confidence.

Belgium Covid-19 active cases drop

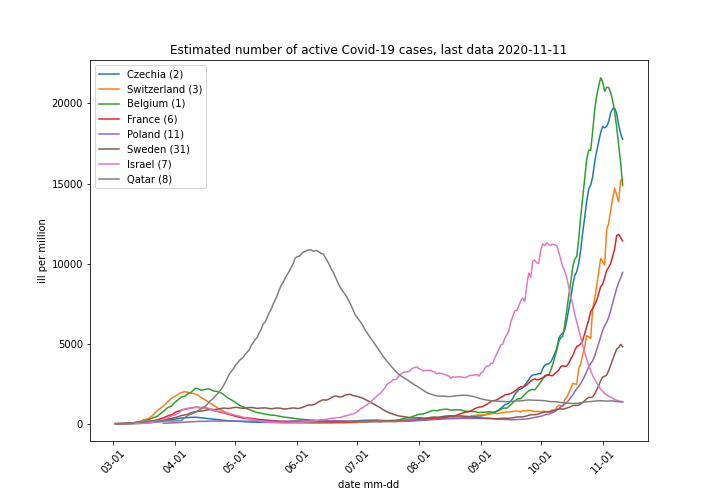
Belgium Covod-19 active cases start to drop. Recent data for this country may be subject to correction, but downtrend is clearly visible. Similar effect may be in Czechia. Please refer to previous posts for explanation how active cases are calculated. Number in brackets after country name is all time rank in active Covid-19 cases count. Countries on chart are sorted top down according to most recent reading.

Please note Poland is now below 50% of Belgium peak value. I’ don’t expect Poland figure to much higher, we likely to see peak forming around current levels.