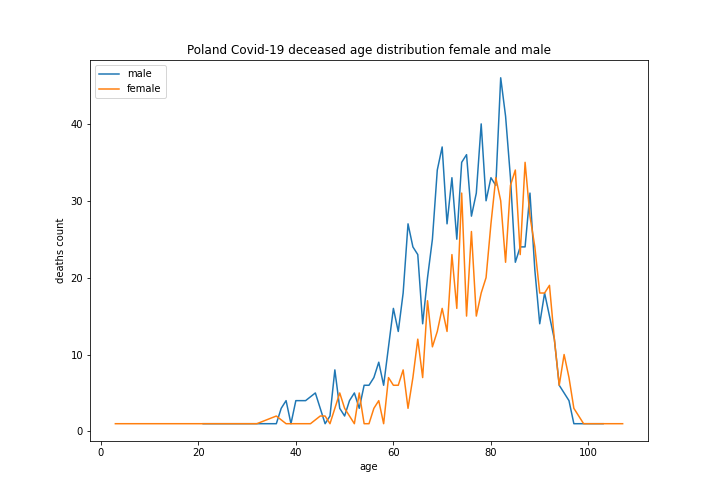
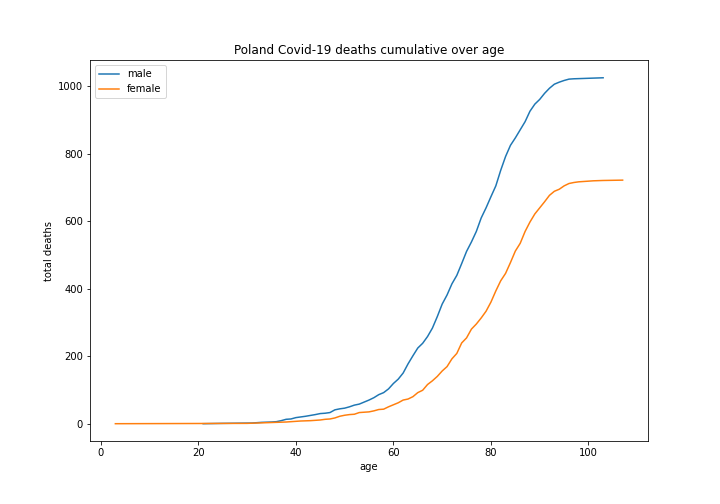
Author Archives: Jacek Błocki

Covid-19 deaths by age

Covid-19 deaths are usually reported as daily totals. It would be interesting to have a look into more details like deceased people age or health condition like chronic illness. Surprisingly such a data are not easily available. I’ve managed to get some detailed data on Covid-19 deaths in Poland, you’ll find them in this post.

Data set

Data presented here come form Poland Ministry of Health, I’ve got them on requests, they are not published regularly. The data represent period from 2020-10-09 to 2020-10-27. Received set has information on:

  1. death date
  2. death place
  3. sex
  4. age

The set has no information on chronic illness. Other statements from ministry show 90% of Covid-19 positive deceases had preexisting illness. Chart below shows age distribution for entire set.

  1. Very few people under 40 die with Covid-19
  2. It would be super interesting to compare above distribution with remaining deaths distribution. Around 1200 die in Poland on daily basis, max Covid-19 positive deaths are 179 in the set. Unfortunately I have no access to the latter distribution. I believe both will be similar. For avoidance of doubts: It does not mean Covid-19 is not dangerous for individuals who contract it.
  3. I believe epidemic dangerous for population should take its toll regardless of age, Covid-19 seems to focus on older ones

Males and females

Charts below show age distribution split by gender.

  1. Men have significantly higher death count till 80, after 80 both distributions are almost identical
  1. Men represent 58% of all deaths, male deaths are (1025-722)/722=42% higher than female

Table below compares age distribution in numbers. Age 25% means 25% of deaths in group are under this age. Please note average lifespan in Poland is 78 years.

allmalefemale
total deaths1747.01025.0722.0
average age75.874.278.1
most common age82.082.087.0
age 25%69.067.072.0
age 50%78.076.080.5
age 75%85.083.087.0

Conclusions

  1. There are little fatalities under 40, just 27 out of 1747 or 1.5%
  2. Covid-19 fatalities are much higher among men than women
  3. Death age distribution shows Covid-19 does not represent a significant threat for population since it spares younger part if it.
  4. Better quantitative analysis of Coviid-19 cases is needed. Number of cases and deaths are floated everywhere. Age of deceased was hard to get. I’ve seen no data on recovered ones like full/partial recovery, time between infection and recovery, hospitalization rate, intensive care time etc.
  5. Lock down or quarantine will not save us, working economy allowing better planning and execution of medical response will.

Covid-19 first and second wave compared

Comparing Covid-19 cases and deaths during first and second wave of epidemic reveals interesting facts. Daily cases during second wave exceed 1st wave figures, while for some countries daily deaths stay significantly lower. One country – Sweden seems to have Covid-19 resilience, people get ill but fatalities are rare.

Method

In order to compare 1st and 2nd wave we make charts for selected countries following steps below:

  1. Second wave data are shown from 1st Oct
  2. First wave data are taken form 15th Mar to 1st June and moved forward by 200 days so they start at 1st Oct after the shift
  3. Both 1st and 2nd wave data are presented on same chard for visual comparison
  4. Deaths per million people are shown on left axis, cases on right one

Belgium

  1. We see daily cases during 2nd wave (peak 1600) significantly surpass 1st wave (peak 200).
  2. Daily deaths are lower during 2nd wave (peak 5) than 1st (peak 25). Of course 2nd wave figures may go up, but so far cart clearly shows daily deaths dynamics is significantly lower during 2nd wave.
  3. Please note recent drop of cases and deaths figure is due to data collection method. Initial data are not accurate and take 3 days to be refined, so both numbers are likely to be revised up.

Netherlands

  1. We see pattern similar to Belgium one: cases 100 vs 600, deaths 14 vs 3. Second wave brings more cases but less deaths
  2. Please note 2nd wave cases for Belgium (1600) more than double Netherlands (600). Belgium mandated face masks in public spaces much earlier than Netherlands, so mask magic should be treated with a grain of salt. Cases detected may be correlated with tests performed, unfortunately ECDC data set I use has no information on tests.

Poland

  1. Both cases and deaths during 2nd wave significantly exceed 1st wave figures.
  2. Lock down during 1st phase delayed Covid-19 impact but failed to eliminate it

Czechia

  1. Czechia shows similar pattern to Poland, unfortunately its cases and deaths figures are much higher
  2. Czechia 2nd wave daily cases are similar to Belgium, but daily deaths are much higher (12 vs 5 for Belgium)

Sweden

  1. Sweden daily cases 2nd wave exceed 1st wave figures, but difference is not as high as Belgium one (2x vs 8x)
  2. There is no growth in daily deaths, figure stays around 0. In other words people get sick but fatalities are rare. It looks as if Sweden population built Covid-19 resilience.

Conclusions

  1. Sweden approach to epidemic worked best so far. First wave may have taken longer, but apparently country population build Covid-19 resilience. This is not immunity, people still get ill but fatalities are rare. I would not call it herd immunity since nobody knows how herd immunity is defined.
  2. Countries with high daily deaths rate during 1st wave have significantly lower rates now. Cumulative deaths estimates as presented in Covidmeter remain valid.
  3. Countries with low death rates during 1st wave are catching up now. For them lock down measures of 1st wave were sort of futile. Of course situation would be different had Covid-19 medication had bee discovered by now.
  4. Panic can increase death toll. Patient with brain stroke or heart attack kept at hospital driveway for several hours due to unclear Covid-19 status is likely to die. Medical personnel adequately equipped with protective gear should be able to treat urgent cases accepting reasonable infection risk.

Covid-19 second wave proves Swedish approach was better

Sweden got a lot of bad press for adopting somehow relaxed approach to Covid-19 lock down. There were voices it caused a carnage especially among elderly people. Figures below show so far Sweden escapes 2nd wave of Covid-19, so maybe what they do is worth investigating.

ECDC data set used it this analysis gives number of deaths on daily basis. Since the number fluctuates quite a lot we calculate a moving average (MA) to eliminate some noise, I use 7 days MA. Figure below shows daily deaths 7 days MA for selected EU countries. We can see 2 peak structure corresponding to 1st and 2nd wave of disease.

Once we have MA we can find a maximum for value for each country and sort it top down thus creating a country ranking. On chart legend ranking is shown in brackets next to country name.

No 2nd wave in Sweden?

Figure below shows same countries from Sep 10th. We see daily deaths are gradually growing for all countries but Sweden. Worst situation is in Czechia, where daily deaths growth is accelerating quite rapidly. Please note Czechia daily deaths now significantly exceed its first wave values, same applies for Poland. Both countries implemented lock down during 1st wave, it seems it only delayed outbreak.

Comparing 1st and 2nd wave

In order to visually compare 1st and 2nd wave 1st wave data for reference country are moved forward along time axis by number of days indicated in chart legend.

So far no country is close to the dynamics of 1st wave of Covid-19 in Belgium. Even Czechia development much less aggressive than it used to be in Belgium.

Current Czechia situation looks similar to 1st wave development in Netherlands.

Conclusions

  1. Swedish approach to Covid-19 resulted in slower drop of daily deaths but no 2nd wave pick up is visible so far.
  2. Belgium mandated face masks in all public spaces while Netherlands not, yet the former has currently higher Covid-19 death rate than the latter. Masks may have some impact on the virus transmission reduction, but they don’t do magic to stop it.
  3. In terms of daily deaths growth 2nd wave is less violent than 1st one.
  4. Countries with low death rates during 1st wave (Czechia, Poland) set new highs during 2nd wave. First lock down did not prevent outbreak, just delayed it.
  5. Swedish approach to epidemic – no lock down but elevated hygiene standards and limits on mass gatherings seem to work better.
  6. Lock downs have a bang in media, but results achieved so far do not justify significant economic burden incurred.
  7. In EU normal daily death rate is around 30 per 1 million. Covid-19 deaths in none of investigated countries are close to that figure.
  8. Covid-19 is likely to stay with us like many other diseases. Subsequent outbreaks are likely to be less severe. it will not kill all, just some. Bad response plans with expedited mass implementation and huge cost may do more harm to everyone than the virus, so watch your politicians.

Covidmeter 2020-10-18

Last Covidmeter update was issued and of May. Unfortunately the disease is still around. Conclusions made a couple of months ago still hold true: Covid-19 takes toll on some individuals, but it does not have significant impact on entire population.

I have decided to restart coverage with just one picture showing number of cumulative Covid-19 deaths per 1 million people. Figure below shows top 5 countries in this ranking along with USA, Russia and Poland which were hand picked. Country rank in cumulative deaths is shown after its name. Diamond Princess and San Marino were added as reference and future impact prediction, please go to previous posts for rationale.

Covidmeter – Cumulative Covid-19 deaths
  1. No Covid-19 fatality was registered in San Marino since May.
  2. Peru now leads in Covid-19 deaths, South America was hit hit in summer like Europe in spring.
  3. Predictions regarding total population impact – 0.2% or 2000 fatalities per million made after Diamond Princess experience hold true. In fact no country so far exceeded San Marino figure.
  4. So far Covid-19 2nd wave in hard hit European countries like Belgium and Spain does not result in steep growth of fatalities comparable to the one in spring
  5. China (not shown on picture) ranking is 161. Unlike other counties it does not experience 2nd wave. They have either eliminated the virus (unlikely) or called off epidemic and focus on treating individual cases as they arise (probable).

Kiedy rośnie DAX

DAX (Deutscher Aktienindex) jest najważniejszym niemieckim indeksem akcji, na który składa się 30 spółek. Indeks jest popularnym instrumentem do spekulacji, na którym wielu chce zarobić, ale większość traci. Podstawowy handel akcjami DAX odbywa się od 9:00 do 17:30. Obrót kontraktami na DAX trwa dłużej. Pewien zasłużony spekulant zadał pytanie o skuteczność następujących strategii inwestycyjnych:

  1. Wchodze w DAX L codzienie o 9 wychodze o 17:30
  2. Wchodze w DAX L o 17:30 wychodze nastepnego dnia o 9:00
  3. Wchodze w DAX S o 17:30 S i wychodze nastepnego dnia o 9:00
  4. Wchodze w DAX L o 15:30 i wychodze o 17:30

Dla nie spekulantów wyjaśnienie: Wchodzę L oznacza kupuje, S sprzedaję. Wyjście polega na wykonaniu operacji odwrotnej. Zysk z transakcji L to różnica wartości DAX na wyjściu i wejściu (sprzedałem drożej niż kupiłem), dla transakcji S odwrotnie.

Żeby odpowiedzieć na pytanie spekulanta przeanalizowałem dane transakcyjne z systemu pewnego brokera regulowanego i sporządziłem kilka wykresów:

  1. Wykresy na podstawie historii notowań DAX zapisanych w plikach .hst terminala mql4.
  2. Wykorzystane dane 30 minutowe. Dysponowałem danymi od listopada 2018.
  3. Wynik obejmuje około 410 transakcji i nie uwzględnia spreadu

Wyniki poszczególnych strategii na wykresach niżej.

Wnioski

  1. Najlepszy wynik uzyskała strategia “2. Wchodze w DAX L o 17:30 wychodze nastepnego dnia o 9:00”
  2. DAX najbardziej zmienia się w czasie, kiedy jego podstawowy rynek jest zamknięty. Kiedy spekulant śpi rynek rośnie?
  3. Wielu spekulantów zamyka pozycje DAX wraz na koniec pracy rynku dla ograniczenia ryzyka. Warto przeanalizować wpływ takiej strategii na zyskowność handlu.

Niniejsze opracowanie służy wyłącznie intelektualnej zabawie z danymi rynkowymi. Autor nie odpowiada za starty spekulantów, nie ma też prawa do udziału w zyskach.

Covidmeter 31.05

Covidmeter findings:

  1. Lock down easing does not result in Covid-19 surge, it was not preventing spread neither. Thus we can call the virus lock down neutral
  2. All quiet in China, reporting is key success factor I presume
  3. Covid-19 worldwide deaths toll scary in absolute numbers pales compared with human population size
  4. Both common cold and Covid-19 are here to stay, they will not take us all from here to eternity, just some individuals

Picture below shows China and San Marino cases over last 6 weeks, we show absolute number. China success is hard to believe if you think about difference i population size.

World summary

Table below shows key numbers on Covid-19 development. ECDC data sets provide information on cases and deaths, so we can find some top scores. Metric come in some variations, they can be combined:

  1. Suffix 1M – per 1 million inhabitants data.
  2. Suffix 7d MA – 7 days moving average
  3. Prefix population > – values calculated for countries above population threshold.
datecountryvaluepopulation
max cumulative cases2020-05-31United States of America1770384327167434
max cumulative deaths2020-05-31United States of America103781327167434
max cumulative cases 1M2020-05-31Qatar198662781677
max cumulative deaths 1M2020-05-24San Marino124333785
max daily deaths 1M 7d MA2020-03-22San Marino6333785
population > 100000,
max cumulative cases 1M
2020-05-31Qatar198662781677
population > 100000,
max cumulative deaths 1M
2020-05-31Belgium82711422068
population > 100000,
max daily deaths 1M 7d MA
2020-04-17Belgium2911422068
population > 100000,
max daily deaths 1M
2020-04-26Ireland484853506
recent cases max2020-05-31Brazil33274209469333
recent deaths max2020-05-31Brazil956209469333
recent cases max 1M2020-05-31Qatar8462781677
recent deaths max 1M2020-05-31Brazil4209469333
worldldwide Covid1-19 cases2020-05-3160275467550105433
worldldwide Covid1-19 deaths2020-05-313705647550105433
  1. USA leads in absolute numbers, it has big population but China one is even bigger and pandemic started there. China either quenched Covid-19 or implemented creative reporting, the former is easier.
  2. San Marino had one Covid-19 death on May 24th, previous one happened 27th April and they report cases on daily basis. There is a good chance the virus penetrated entire population, killed 0.12%, This hardly qualifies as carnage.
  3. Daily deaths maximum straight number (Ireland) and moving average (Belgium) were scored back in April
  4. Absolute number of deaths is impressive but it represents around 1% of all deaths on Earth in Feb – mid May time frame. Human population is huge, we are mortal, 7.5 billion population produces in average over 200 thousands deaths per day.

Top countries

Figures below show top 30 countries selected by cumulative number of cases. The group represents 89% of total cases and 94% of total deaths. In top 30 group lowest cumulative cases figure is 30.7 thousand cases.

  1. Countries are sorted by cumulative cases per 1 million people
  2. China (CN) is unique in its ability to stop Covid-19. No other country poor nor rich small nor big was able to repeat its success. China culture is not about social distancing. Is superb quarantine or rather creative reporting behind China success?
  1. Countries are sorted by cumulative deaths per 1 million people
  2. Again China is at the end. Normally country first hit by epidemic will suffer most, others can learn from its experience and prepare a better response. Maybe they are stubborn to learn and inept to implement solutions instantly developed in China?
  1. Countries are sorted by cases mortality
  2. Please note wide range of cases mortality rate, from 0.1% Singapore to 20% France. This indicates wide difference in both death and case definition.

Covid-19 cases and deaths evolution

Figure below compare recent and reference values. We show Covid-19 cases and deaths. Countries are selected in the following way:

  1. Dashed lines represent reference countries, we are looking for historical maximum in the following categories:
    1. cumulative cases (cc),
    2. cumulative cases per 1 million people (cc_1M),
    3. cases per 1 million people 7 days moving average (cma_1M)
  2. Solid lines represent 3 countries with top recent cma_1M.
  3. Country once selected is excluded from subsequent selections.

Rule for deaths comparison is similar to cases one.

  1. Quatar reports significantly more cases per million people than any country, while its death toll is low (see earlier charts). We see historical maximum in cumulative cases per million and cases per million moving average now, so Quatar line is dashed. This can be explained either by superb testing coverage or long lag between infection (case) and death. Please note cases surge took place in April. Lock down measures did not help to prevent it.
  2. South America and Persian Gulf is Covid-19 are hot spots, again lock down does not prevent Covid-19 spread.
  1. No country is close to make new record in this category

Cases mortality comparison

We calculate cases mortality dividing cumulative deaths by cumulative cases. High and low cases mortality countries are selected in the following way:

  1. More than 20 cumulative deaths and 10000 cumulative cases
  2. Sort by cases mortality rate
  3. Take top 5 and bottom 5 from above list
  4. Add Germany to result
  1. Top mortality countries is stable
  2. Russia left low mortality group

Chart below shows countries with lowest mortality rate with Russia added.

  1. Russia has very high number of cases, almost 400 thousands
  2. Singapore has around 34 thousands cases and very low mortality rate, total deaths as of 31.05 are 23.

Cumulative deaths per 1 million people

  1. Leaders group is constant

Covidmeter

Covidmeter compares cumulative deaths per million people for top countries with reference. Reference countries are:

  1. Diamond Princess cruise ship
  2. San Marino – country, enclave in Italy

DP development is closed, crew and passengers disembarked the ship. San Marino is a live group, the country has tiny population, over 30 thousands, but it was hard hit my Covid-19.

  1. No country came close to Diamond Princess death toll declared limit at the beginning of April
  2. San Marino still reports Covid-19 cases on daily basis, last deaths were reported 27th April and 24th May. Neither Covid-19 nor common cold will be fully eliminated there.

Covidmeter 22.05

Covidmeter findings:

  1. Lock down does not prevent Covid-19 spread
  2. China reporting standards are different than other countries. You can call it cheating if you like. It is just a tag, however Chinese propaganda will not like it
  3. Covid-19 deaths toll scary in absolute numbers pales compared with population size
  4. Both common cold and Covid-19 are here to stay, they will not take us all from here to eternity, just some individuals

World summary

Table below shows key numbers on Covid-19 development. ECDC data sets provide information on cases and deaths, so we can find some top scores. Metric come in some variations, they can be combined:

  1. Suffix 1M – per 1 million inhabitants data.
  2. Suffix 7d MA – 7 days moving average
  3. Prefix population > – values calculated for countries above population threshold.
datecountryvaluepopulation
max cumulative cases2020-05-22United States of America1577287327167434
max cumulative deaths2020-05-22United States of America94702327167434
max cumulative cases 1M2020-05-22San Marino1947633785
max cumulative deaths 1M2020-04-27San Marino121333785
max daily deaths 1M 7d MA2020-03-22San Marino6333785
population > 100000,
max cumulative cases 1M
2020-05-22Qatar138942781677
population > 100000,
max cumulative deaths 1M
2020-05-22Belgium80411422068
population > 100000,
max daily deaths 1M 7d MA
2020-04-17Belgium2911422068
population > 100000,
max daily deaths 1M
2020-04-26Ireland484853506
recent cases max2020-05-22United States of America25434327167434
recent deaths max2020-05-22United States of America1263327167434
recent cases max 1M2020-05-22Qatar5582781677
recent deaths max 1M2020-05-22Brazil5209469333
worldldwide Covid1-19 cases2020-05-2250670877550105433
worldldwide Covid1-19 deaths2020-05-223327047550105433
  1. USA leads in absolute numbers, it has big population but China one is even bigger and pandemic started there. China either quenched Covid-19 or implemented creative reporting, the former is easier.
  2. In San Marino nobody died due to Covid-19 since 27th April and they report cases on daily basis. There is a good chance the virus penetrated entire population, killed 0.12%, This hardly qualifies as carnage.
  3. Daily deaths maximum straight number (Ireland) and moving average (Belgium) were scored back in April
  4. Absolute number of deaths is impressive but it represents around 1% of all deaths on Earth in Feb – mid May time frame. Human population is huge, we are mortal, 7.5 billion population produces in average over 200 thousands deaths per day.

Top countries

Figures below show top 30 countries selected by cumulative number of cases. The group represents 90% of total cases and 95% of total deaths. In top 30 group lowest cumulative cases figure is 24.3 thousands cases.

  1. Countries are sorted by cumulative cases per 1 million people
  2. China (CN) is unique in its ability to stop Covid-19. No other country poor nor rich small nor big was able to repeat its success. China culture is not about social distancing. Is superb quarantine or rather creative reporting behind China success?
  1. Countries are sorted by cumulative deaths per 1 million people
  2. Again China is at the end. Normally country first hit by epidemic will suffer most, others can learn from its experience and prepare a better response. Maybe they are stubborn to learn and inept to implement solutions instantly developed in China?
  1. Countries are sorted by cases mortality
  2. Please note wide range of cases mortality rate, from 1% Russia to 20% France. This indicates wide difference in both death and case definition.

Covid-19 cases and deaths evolution

Figure below compare recent and reference values. We show Covid-19 cases and deaths. Countries are selected in the following way:

  1. Dashed lines represent reference countries, we are looking for historical maximum in the following categories:
    1. cumulative cases (cc),
    2. cumulative cases per 1 million people (cc_1M),
    3. cases per 1 million people 7 days moving average (cma_1M)
  2. Solid lines represent 3 countries with top recent cma_1M.
  3. Country once selected is excluded from subsequent selections.

Rule for deaths comparison is similar to cases one.

  1. Quatar reports significantly more cases per million people than any country, while its death toll is low (see earlier charts). We see historical maximum in cumulative cases per million and cases per million moving average now, so Quatar line is dashed. This can be explained either by superb testing coverage or long lag between infection (case) and death. Please note cases surge took place in April. Lock down measures did not help to prevent it.
  2. Singapore (SG) is no longer among top cases countries.
  3. South America and Persian Gulf is Covid-19 are hot spots, again lock down does not prevent Covid-19 spread.
  1. Deaths per 1 million people are dropping
  2. Brazil replaced Italy and its deaths per million are on rise.
  3. Contrary to some media claims there is no surge in Sweden deaths.

Cases mortality comparison

We calculate cases mortality dividing cumulative deaths by cumulative cases. High and low cases mortality countries are selected in the following way:

  1. More than 20 cumulative deaths and 10000 cumulative cases
  2. Sort by cases mortality rate
  3. Take top 5 and bottom 5 from above list
  4. Add Germany to result
  1. Top mortality countries is stable, so is low group
  2. Mortality rate in UK drops, this may be due to increased testing capacity or Covid-19 true cases peak – everybody prone to virus already infected.

Chart below shows countries with lowest mortality rate.

  1. Russia has very high number of cases, above 300 thousands, this is order of magnitude higher than other countries on chart. Interesting is mortality rate for Russia stays constant. For other countries it went up once number of cases soared.
  2. Singapore has around 30 thousands cases and very low mortality rate, total deaths as of 12.05 are 23.

Cumulative deaths per 1 million people

  1. Leaders group is constant

Covidmeter

Covidmeter compares cumulative deaths per million people for top countries with reference. Reference countries are:

  1. Diamond Princess cruise ship
  2. San Marino – country, enclave in Italy

DP development is closed, crew and passengers disembarked the ship. San Marino is a live group, the country has tiny population, over 30 thousands, but it was hard hit my Covid-19.

  1. No country came close to Diamond Princess death toll declared limit at the beginning of April
  2. San Marino still reports Covid-19 cases on daily basis, last death was reported 27th April. Neither Covid-19 nor common cold will be fully eliminated there.

Covid-19 beyond borders

United States of America are leading other states in both Covid-19 cases and deaths. Let us have a look at Covid-19 pandemic reshuffling current states a bit. We combine existing countries data to create just 4 states:

  1. Union – USA
  2. Semi Union – European Union and UK
  3. Former Union – Russian Federation and former Soviet Union except Baltic
  4. Otherland – Remaining countries

Thus we have 3 unions with similar population size and rest of the world to compare with. Please not on picture below population is in US billions (10e9).

Otherland dwarfs unions in terms of population. Chart below shows just Unions. Variation in population size are due to the way ECDC data set is build – countries were added once they start to report Covid-19 case and deaths.

Absolute numbers – daily

On carts below we show absolute values for cases and deaths in each country. Both per day values and cumulative figures are presented. Country is marked once its cumulative cases figure tops 100. In absolute terms countries as we defined them are comparable in terms of detected cases, despite huge Otherland population.

  1. Looking at daily cases Otherland is on rise. Cases in Unions may have reached peak.
  2. Does grater territory size translate to a broader peak?
  3. Please note Covid-19 in Otherland started much earlier than in Unions.
  4. Initially testing capacity was low, it expanded rapidly often at expense of quality. Early cases may be under detected.
  5. Lack of single test standard adopted worldwide results in systematic errors.
  6. Otherland cases started earlier than Unions, yet daily cases surge happened later. This may result from decision (China) to stop cases reporting, after realizing the virus does less harm than hysteria around it. In modern information flow it is easier to make people forget by presenting fake victory, than convince them the virus is much less dangerous than initially afraid.
  1. Please note relatively low number of deaths in Former Union. This may be due to different criteria adopted to qualify deceased one as Covid-19 victim.
  2. Until now there is no singe Covid-19 death definition adopted worldwide. This is a serious failure of bodies like WHO. Some countries (Belgium, UK) report death even if no virus was detected. Patients with chronic lethal diseases are often declared Covid-19 victims, while the virus was not sole culprit.

Absolute numbers – cumulative

  1. Former union was in lock down, yet it experienced surge of cases after some delay. Quarantine measures may slow but not stop Covid-19 spread.
  1. Semi Union leads them all. Lead over Union can be attributed to broader definition of Covid-19 death.
  2. Former Union Covid-19 death definition is narrower, Covid-19 patient with cardiovascular disease history dying after hear attach is not counted as the virus victim. Cumulative deaths data confirm it.

Per million people data – daily

  1. Assuming virus is the same Union has the best testing capability.
  2. Peak infection already happened in all unions
  3. Otherland is either not testing or not reporting
  4. Test showing population share with antibodies (those who got the virus and recovered) would be really interesting. Union has plans to have one. Former Union will follow. Semi Union will have a long dispute about it. Otherland is excused since nobody can decide on it. I guess part of Otherland did the test and decided not to advertise it.
  1. Union and Semi Union have almost exactly the same – 8 – peak deaths per million people. Is it pure coincidence?
  2. Please note average death rate in developed countries is around 30 people per million per day.

Per million people data – cumulative

  1. Union leads. Best testing capability results in highest number of cases detected
  1. Semi Union and Union are comparable. Semi Union outbreak started earlier, so its figure is higher
  2. Former Union figure is much lower and it will stay like that due to narrower definition of Covid-19 death

Conclusions

  1. To understand situation use per million figures and compare with reference. Remember in average for each million 30 people die per day.
  2. Take some time to understand how numbers are produced. Former Union on deaths may be under reported, while Union and Semi Union ones are overstated. None is cheating, they just adopted different definition.
  3. Covid-19 seems to be developed countries problem. It is driven by media hype rather than actual virus impact. People like horror stories so they are fed with them.
  4. Lock down does not prevent virus spread, just buys 2-3 weeks delay.
  5. Maintaining hygiene standards helps to prevent any disease spread.
  6. Prolonged economy shutdown will do much hurt than the virus itself.
  7. In poor countries there are more prominent threats than Covid-19. Have a look at this clip from the move Lord of War, it explains situation well.

Covidmeter 14.05

Mid May Covidmeter findings:

  1. Lock down does not prevent Covid-19 spread
  2. China reporting standards are different than other countries. You can call it cheating if you like. It is just a tag, however Chinese propaganda will not like it
  3. Covid-19 deaths toll scary in absolute numbers pales compared with population size
  4. Both common cold and Covid-19 are here to stay, they will not take us all from here to eternity, just some individuals

World summary

Table below shows key numbers on Covid-19 development. ECDC data sets provide information on cases and deaths, so we can find some top scores. Metric come in some variations, they can be combined:

  1. Suffix 1M – per 1 million inhabitants data.
  2. Suffix 7d MA – 7 days moving average
  3. Prefix population > – values calculated for countries above population threshold.
datecountryvaluepopulation
max cumulative cases2020-05-14United States of America1390746327167434
max cumulative deaths2020-05-14United States of America84133327167434
max cumulative cases 1M2020-05-14San Marino1903233785
max cumulative deaths 1M2020-04-27San Marino121333785
max daily deaths 1M 7d MA2020-03-22San Marino6333785
population > 100000,
max cumulative cases 1M
2020-05-14Qatar95402781677
population > 100000,
max cumulative deaths 1M
2020-05-14Belgium77411422068
population > 100000,
max daily deaths 1M 7d MA
2020-04-17Belgium2911422068
population > 100000,
max daily deaths 1M
2020-04-26Ireland484853506
worldldwide Covid1-19 cases2020-05-1443095087547997301
worldldwide Covid1-19 deaths2020-05-142986737547997301
  1. USA leads in absolute numbers, it has big population but China one is even bigger and pandemic started there. China either quenched Covid-19 or implemented creative reporting, the former is easier.
  2. In San Marino nobody died due to Covid-19 since 27th April and they report cases on daily basis. There is a good chance the virus penetrated entire population, killed 0.12%, This hardly qualifies as carnage.
  3. Daily deaths maximum straight number (Ireland) and moving average (Belgium) were scored back in April
  4. Absolute number of deaths is impressive but it represents around 1% of all deaths on Earth in Feb – mid May time frame. Human population is huge, we are mortal, 7.5 billion population produces in average over 200 thousands deaths per day.

Top countries

Figures below show top 30 countries selected by cumulative number of cases. The group represents 90% of total cases and 95% of total deaths.

  1. Countries are sorted by cumulative cases per 1 million people
  2. China (CN) is unique in its ability to stop Covid-19. No other country poor nor rich small nor big was able to repeat its success. China culture is not about social distancing. Is superb quarantine or rather creative reporting behind China success?
  1. Countries are sorted by cumulative deaths per 1 million people
  2. Again China is at the end. Normally country first hit by epidemic will suffer most, others can learn from its experience and prepare a better response. Maybe they are stubborn to learn and inept to implement solutions instantly developed in China?
  1. Countries are sorted by cases mortality
  2. Please note wide range of cases mortality rate, from 1% Russia to 20% France. This indicates wide difference in both death and case definition.

Covid-19 cases and deaths evolution

Figure below compare recent and reference values. We show Covid-19 cases and deaths. Countries are selected in the following way:

  1. Dashed lines represent reference countries, we are looking for historical maximum in the following categories:
    1. cumulative cases (cc),
    2. cumulative cases per 1 million people (cc_1M),
    3. cases per 1 million people 7 days moving average (cma_1M)
  2. Solid lines represent 3 countries with top recent cma_1M.
  3. Country once selected is excluded from subsequent selections.

Rule for death comparison is similar to cases one.

  1. Quatar reports 4 times more cases per million people than next country in this category, while its death toll is low (see earlier charts). We see historical maximum in cumulative cases per million and cases per million moving average now, so Quatar line is dashed. This can be explained either by superb testing coverage or long lag between infection (case) and death. Please note cases surge took place in April. Lock down measures did not help to prevent it.
  2. Singapore (SG) was in lock down, observed social distancing, is geographically isolated, has strong somewhat authoritarian government. Yet it experienced Covid-19 outbreak in April. It seems no one but China can implement lock down properly.
  3. Quatar, Bahrain and Kuwait are top 3 in recently detected cases. Persian Gulf is Covid-19 hot spot, again lock down does not prevent Covid-19 spread.
  1. Deaths per 1 million people are dropping
  2. In Italy we see a jump of daily deaths. Covid-19 takes long time to incubate and produce fatality, so it may be not directly related to lock down easing. Increased figure is still low comparing to historical values.

Cases mortality comparison

We calculate cases mortality dividing cumulative deaths by cumulative cases. High and low cases mortality countries are selected in the following way:

  1. More than 20 cumulative deaths and 10000 cumulative cases
  2. Sort by cases mortality rate
  3. Take top 5 and bottom 5 from above list
  4. Add Germany to result
  1. Top mortality countries is stable
  2. Mortality rate in UK drops, this may be due to increased testing capacity or Covid-19 true cases peak – everybody prone to virus already infected.

Chart below shows countries with lowest mortality rate.

  1. Russia has very high number of cases, above 110 thousands, this is order of magnitude higher than other countries on chart. Interesting is mortality rate for Russia stays constant. For other countries it went up once number of cases soared.
  2. SIngapore has over 20 thousands cases and very low mortality rate, total deaths as of 14.05 are 21.

Cumulative deaths per 1 million people

  1. Leaders group is constant
  2. Italy shows increase, too early to declare it a trend

Covidmeter

Covidmeter compares cumulative deaths per million people for top countries with reference. Reference countries are:

  1. Diamond Princess cruise ship
  2. San Marino – country, enclave in Italy

DP development is closed, crew and passengers disembarked the ship. San Marino is a live group, the country has tiny population, over 30 thousands, but it was hard hit my Covid-19.

  1. No country came close to Diamond Princess death toll declared limit at the beginning of April
  2. San Marino still reports Covid-19 cases on daily basis, last death was reported 27th April. Neither Covid-19 nor common cold will be fully eliminated there.

Covid19 collateral damage

Collateral damage comes from military, it means unintended death or injury resulting from military operations. There is a good chance Covid19 pandemic fight results in deaths of people not infected with the virus itself, so it has collateral damage.

Inflated death count

Belgium reported recently a substantial number of Covid19 deaths, it made it the world leader in mortality per million of people. There were comments in local media suggesting all deaths in nursery houses for old people were qualified as Covid19 related, without confirming actual virus presence in deceased. Indeed on official page info-coronavirus.be you can find information like the one above dated 17.04:

Of the 5 163 people who died, 44% died in hospital, 54% in a rest and care home, 0.6% at home and 0.2% in another location. The deaths in hospital are all confirmed cases. Deaths in rest homes are either confirmed cases (7.8%) or suspected cases (92%)

Source

Population mortality impact

Since half of deaths contributed to Covid19 are just suspected, there is clearly a bias to attribute all deaths to the virus, inflate its toll. On the same site you can find information on total mortality in Belgium, chart copied from the article is displayed below.

Source: Analysis on the excess mortality due to Covid-19

There is a clearly visible surge of daily deaths, from mid March to mid April, we can read the following numbers:

  • Total deaths 300 to 600 (solid orange)
  • Covid19 confirmed 0 to 100 (dashed green)
  • Covid19 confirmed and suspected 0 to 300 (solid green)
  • Covid19 suspected 0 to 200 – difference between Covid19 total and suspected – area between solid and dashed green

Covid19 collateral damage – suspected deaths

Covid19 suspected deaths are those from care (nursery) homes, who passed away and had no positive Covid19 test. It is not clear if medical authorities plan to confirm virus presence in post-mortem. We can presume suspected and confirmed deaths alike are reported as Covid19 deaths. This is a flaw, suspected deaths should be verified, there may not result from the virus directly. They may be just collateral damage resulting from:

  1. Elevated stress level. Media stories about Covid19 mortality, especially among older people clearly make people anxious and raise stress level. Extraordinary lock down measures taken by government don’t make people tranquil. Permanent stress is hazardous, it deteriorates health and may result in premature death.
  2. Medical resources focused on epidemic response reduce care level for patients with chronic disease. This does not result from bad faith, just shortage of resources and allocation inefficiencies.

Death from virus and collateral damage separation

In order to understand epidemic impact It is important to report death causes correctly. We have a combination of virus epidemic and fear epidemic. Inflating deaths related to the former does not make curbing the latter easier. Belgium decision to report suspected cases had big impact on reported numbers:

Of the 7 094 people who died, 45% died in hospital, 53% in a rest and care home, 0% at home and 0% elsewhere. The hospital deaths are all confirmed cases. The deaths in rest homes are both confirmed (10%) and suspected (90%) cases.

Source 26.04 report

7094 * 0.53% * 0.9 = 3384, almost 48% of total deaths are suspected ones. This introduces a huge margin of error to collected data. Some suspected cases are direct Civid19 victims, others are collateral damage, proportion remains unknown.

Medical resources allocation issues examples

  • Hungary decided to empty hospitals. In early April the Hungary government ordered hospitals to ensure that over 30,000 are available for Covid19 patients, the number was then increased to 40000. Hungary has recorded 250 deaths from the Covid19 as of 24.04, and has 2,383 known cases. This had an impact on existing patients who were forced home.
  • Italian province Lombardy hard hit my Covid19 had many hospital beds available, but was short on family doctors and general practitioners. Patients who should have been recovering at home were taken to hospital, putting undue stress on capacity. Doctors making house visits were not adequately protected. Some died and others may have inadvertently spread the virus. Details here.

Final advice

Stay calm and breath normally. Excessive fear of Covid19 can kill you faster than the virus. Virus can sneak in, decision to join collateral damage ranks is on you.