Category Archives: Covid-19

Covid-19 second wave proves Swedish approach was better

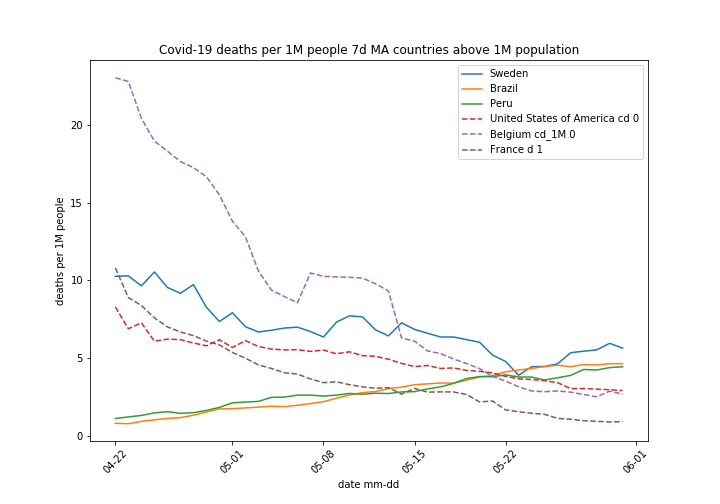
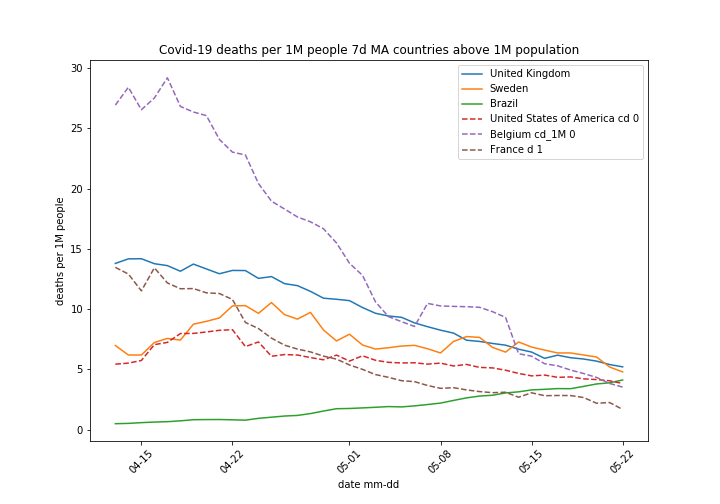
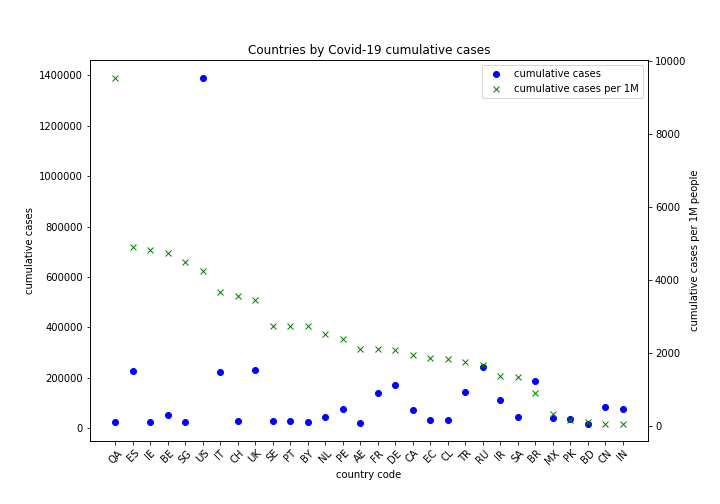
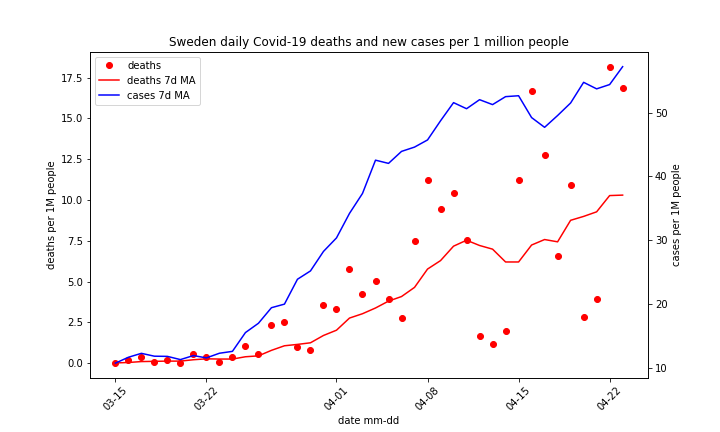
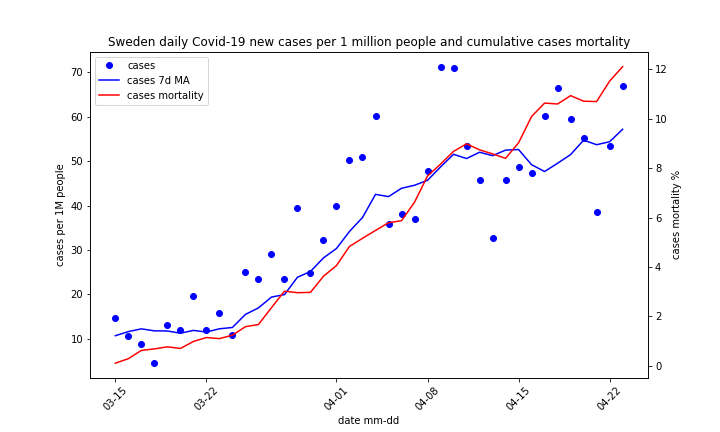
Sweden got a lot of bad press for adopting somehow relaxed approach to Covid-19 lock down. There were voices it caused a carnage especially among elderly people. Figures below show so far Sweden escapes 2nd wave of Covid-19, so maybe what they do is worth investigating.

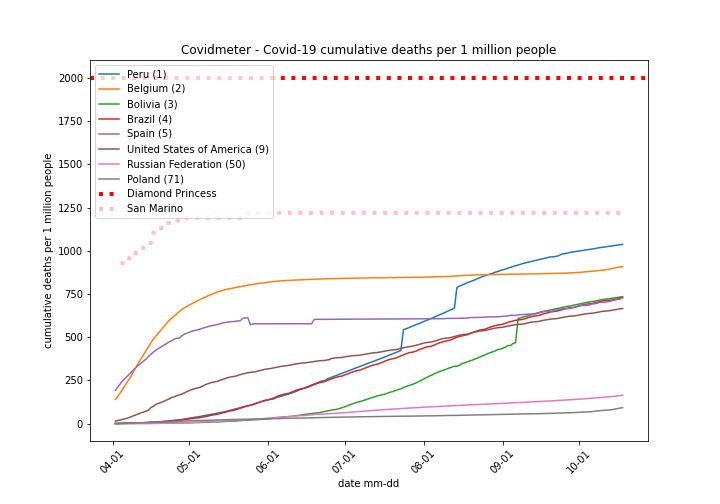
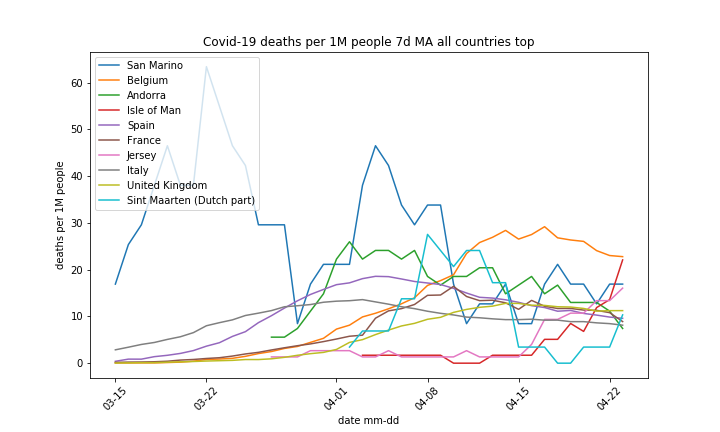
ECDC data set used it this analysis gives number of deaths on daily basis. Since the number fluctuates quite a lot we calculate a moving average (MA) to eliminate some noise, I use 7 days MA. Figure below shows daily deaths 7 days MA for selected EU countries. We can see 2 peak structure corresponding to 1st and 2nd wave of disease.

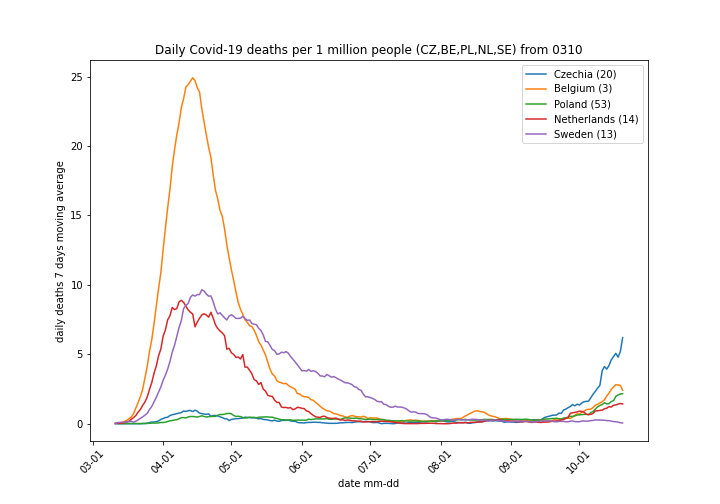
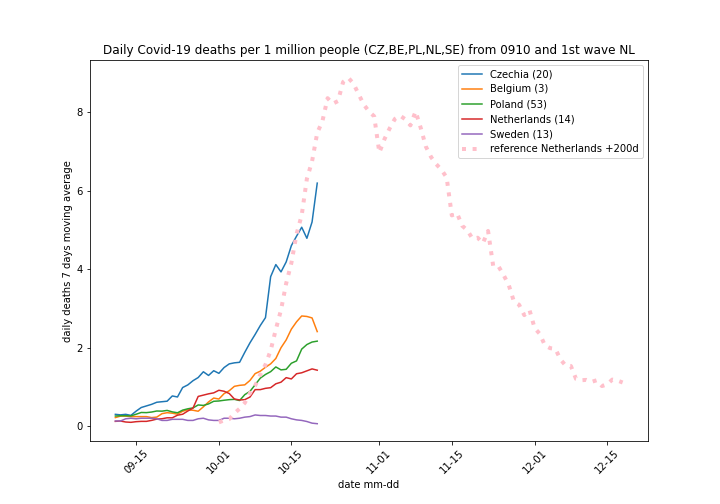
Once we have MA we can find a maximum for value for each country and sort it top down thus creating a country ranking. On chart legend ranking is shown in brackets next to country name.

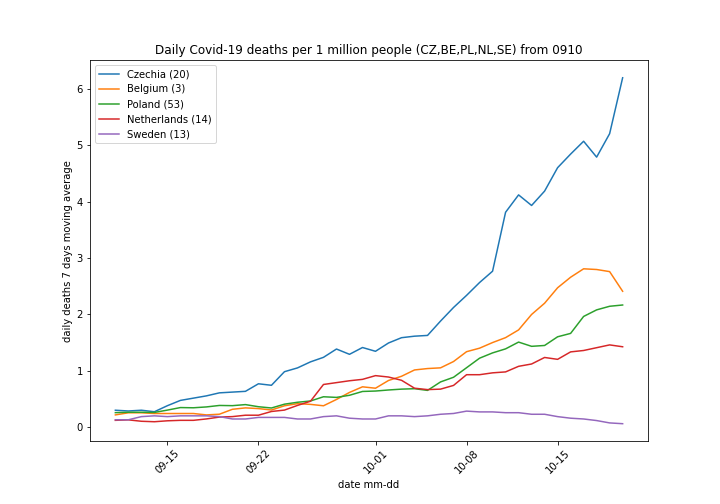
No 2nd wave in Sweden?

Figure below shows same countries from Sep 10th. We see daily deaths are gradually growing for all countries but Sweden. Worst situation is in Czechia, where daily deaths growth is accelerating quite rapidly. Please note Czechia daily deaths now significantly exceed its first wave values, same applies for Poland. Both countries implemented lock down during 1st wave, it seems it only delayed outbreak.

Comparing 1st and 2nd wave

In order to visually compare 1st and 2nd wave 1st wave data for reference country are moved forward along time axis by number of days indicated in chart legend.

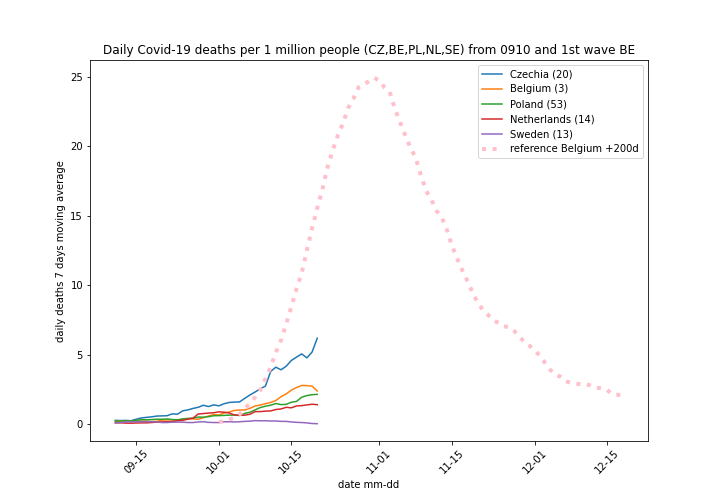
So far no country is close to the dynamics of 1st wave of Covid-19 in Belgium. Even Czechia development much less aggressive than it used to be in Belgium.

Current Czechia situation looks similar to 1st wave development in Netherlands.

Conclusions

  1. Swedish approach to Covid-19 resulted in slower drop of daily deaths but no 2nd wave pick up is visible so far.
  2. Belgium mandated face masks in all public spaces while Netherlands not, yet the former has currently higher Covid-19 death rate than the latter. Masks may have some impact on the virus transmission reduction, but they don’t do magic to stop it.
  3. In terms of daily deaths growth 2nd wave is less violent than 1st one.
  4. Countries with low death rates during 1st wave (Czechia, Poland) set new highs during 2nd wave. First lock down did not prevent outbreak, just delayed it.
  5. Swedish approach to epidemic – no lock down but elevated hygiene standards and limits on mass gatherings seem to work better.
  6. Lock downs have a bang in media, but results achieved so far do not justify significant economic burden incurred.
  7. In EU normal daily death rate is around 30 per 1 million. Covid-19 deaths in none of investigated countries are close to that figure.
  8. Covid-19 is likely to stay with us like many other diseases. Subsequent outbreaks are likely to be less severe. it will not kill all, just some. Bad response plans with expedited mass implementation and huge cost may do more harm to everyone than the virus, so watch your politicians.

Covidmeter 2020-10-18

Last Covidmeter update was issued and of May. Unfortunately the disease is still around. Conclusions made a couple of months ago still hold true: Covid-19 takes toll on some individuals, but it does not have significant impact on entire population.

I have decided to restart coverage with just one picture showing number of cumulative Covid-19 deaths per 1 million people. Figure below shows top 5 countries in this ranking along with USA, Russia and Poland which were hand picked. Country rank in cumulative deaths is shown after its name. Diamond Princess and San Marino were added as reference and future impact prediction, please go to previous posts for rationale.

Covidmeter – Cumulative Covid-19 deaths
  1. No Covid-19 fatality was registered in San Marino since May.
  2. Peru now leads in Covid-19 deaths, South America was hit hit in summer like Europe in spring.
  3. Predictions regarding total population impact – 0.2% or 2000 fatalities per million made after Diamond Princess experience hold true. In fact no country so far exceeded San Marino figure.
  4. So far Covid-19 2nd wave in hard hit European countries like Belgium and Spain does not result in steep growth of fatalities comparable to the one in spring
  5. China (not shown on picture) ranking is 161. Unlike other counties it does not experience 2nd wave. They have either eliminated the virus (unlikely) or called off epidemic and focus on treating individual cases as they arise (probable).

Covidmeter 31.05

Covidmeter findings:

  1. Lock down easing does not result in Covid-19 surge, it was not preventing spread neither. Thus we can call the virus lock down neutral
  2. All quiet in China, reporting is key success factor I presume
  3. Covid-19 worldwide deaths toll scary in absolute numbers pales compared with human population size
  4. Both common cold and Covid-19 are here to stay, they will not take us all from here to eternity, just some individuals

Picture below shows China and San Marino cases over last 6 weeks, we show absolute number. China success is hard to believe if you think about difference i population size.

World summary

Table below shows key numbers on Covid-19 development. ECDC data sets provide information on cases and deaths, so we can find some top scores. Metric come in some variations, they can be combined:

  1. Suffix 1M – per 1 million inhabitants data.
  2. Suffix 7d MA – 7 days moving average
  3. Prefix population > – values calculated for countries above population threshold.
datecountryvaluepopulation
max cumulative cases2020-05-31United States of America1770384327167434
max cumulative deaths2020-05-31United States of America103781327167434
max cumulative cases 1M2020-05-31Qatar198662781677
max cumulative deaths 1M2020-05-24San Marino124333785
max daily deaths 1M 7d MA2020-03-22San Marino6333785
population > 100000,
max cumulative cases 1M
2020-05-31Qatar198662781677
population > 100000,
max cumulative deaths 1M
2020-05-31Belgium82711422068
population > 100000,
max daily deaths 1M 7d MA
2020-04-17Belgium2911422068
population > 100000,
max daily deaths 1M
2020-04-26Ireland484853506
recent cases max2020-05-31Brazil33274209469333
recent deaths max2020-05-31Brazil956209469333
recent cases max 1M2020-05-31Qatar8462781677
recent deaths max 1M2020-05-31Brazil4209469333
worldldwide Covid1-19 cases2020-05-3160275467550105433
worldldwide Covid1-19 deaths2020-05-313705647550105433
  1. USA leads in absolute numbers, it has big population but China one is even bigger and pandemic started there. China either quenched Covid-19 or implemented creative reporting, the former is easier.
  2. San Marino had one Covid-19 death on May 24th, previous one happened 27th April and they report cases on daily basis. There is a good chance the virus penetrated entire population, killed 0.12%, This hardly qualifies as carnage.
  3. Daily deaths maximum straight number (Ireland) and moving average (Belgium) were scored back in April
  4. Absolute number of deaths is impressive but it represents around 1% of all deaths on Earth in Feb – mid May time frame. Human population is huge, we are mortal, 7.5 billion population produces in average over 200 thousands deaths per day.

Top countries

Figures below show top 30 countries selected by cumulative number of cases. The group represents 89% of total cases and 94% of total deaths. In top 30 group lowest cumulative cases figure is 30.7 thousand cases.

  1. Countries are sorted by cumulative cases per 1 million people
  2. China (CN) is unique in its ability to stop Covid-19. No other country poor nor rich small nor big was able to repeat its success. China culture is not about social distancing. Is superb quarantine or rather creative reporting behind China success?
  1. Countries are sorted by cumulative deaths per 1 million people
  2. Again China is at the end. Normally country first hit by epidemic will suffer most, others can learn from its experience and prepare a better response. Maybe they are stubborn to learn and inept to implement solutions instantly developed in China?
  1. Countries are sorted by cases mortality
  2. Please note wide range of cases mortality rate, from 0.1% Singapore to 20% France. This indicates wide difference in both death and case definition.

Covid-19 cases and deaths evolution

Figure below compare recent and reference values. We show Covid-19 cases and deaths. Countries are selected in the following way:

  1. Dashed lines represent reference countries, we are looking for historical maximum in the following categories:
    1. cumulative cases (cc),
    2. cumulative cases per 1 million people (cc_1M),
    3. cases per 1 million people 7 days moving average (cma_1M)
  2. Solid lines represent 3 countries with top recent cma_1M.
  3. Country once selected is excluded from subsequent selections.

Rule for deaths comparison is similar to cases one.

  1. Quatar reports significantly more cases per million people than any country, while its death toll is low (see earlier charts). We see historical maximum in cumulative cases per million and cases per million moving average now, so Quatar line is dashed. This can be explained either by superb testing coverage or long lag between infection (case) and death. Please note cases surge took place in April. Lock down measures did not help to prevent it.
  2. South America and Persian Gulf is Covid-19 are hot spots, again lock down does not prevent Covid-19 spread.
  1. No country is close to make new record in this category

Cases mortality comparison

We calculate cases mortality dividing cumulative deaths by cumulative cases. High and low cases mortality countries are selected in the following way:

  1. More than 20 cumulative deaths and 10000 cumulative cases
  2. Sort by cases mortality rate
  3. Take top 5 and bottom 5 from above list
  4. Add Germany to result
  1. Top mortality countries is stable
  2. Russia left low mortality group

Chart below shows countries with lowest mortality rate with Russia added.

  1. Russia has very high number of cases, almost 400 thousands
  2. Singapore has around 34 thousands cases and very low mortality rate, total deaths as of 31.05 are 23.

Cumulative deaths per 1 million people

  1. Leaders group is constant

Covidmeter

Covidmeter compares cumulative deaths per million people for top countries with reference. Reference countries are:

  1. Diamond Princess cruise ship
  2. San Marino – country, enclave in Italy

DP development is closed, crew and passengers disembarked the ship. San Marino is a live group, the country has tiny population, over 30 thousands, but it was hard hit my Covid-19.

  1. No country came close to Diamond Princess death toll declared limit at the beginning of April
  2. San Marino still reports Covid-19 cases on daily basis, last deaths were reported 27th April and 24th May. Neither Covid-19 nor common cold will be fully eliminated there.

Covidmeter 22.05

Covidmeter findings:

  1. Lock down does not prevent Covid-19 spread
  2. China reporting standards are different than other countries. You can call it cheating if you like. It is just a tag, however Chinese propaganda will not like it
  3. Covid-19 deaths toll scary in absolute numbers pales compared with population size
  4. Both common cold and Covid-19 are here to stay, they will not take us all from here to eternity, just some individuals

World summary

Table below shows key numbers on Covid-19 development. ECDC data sets provide information on cases and deaths, so we can find some top scores. Metric come in some variations, they can be combined:

  1. Suffix 1M – per 1 million inhabitants data.
  2. Suffix 7d MA – 7 days moving average
  3. Prefix population > – values calculated for countries above population threshold.
datecountryvaluepopulation
max cumulative cases2020-05-22United States of America1577287327167434
max cumulative deaths2020-05-22United States of America94702327167434
max cumulative cases 1M2020-05-22San Marino1947633785
max cumulative deaths 1M2020-04-27San Marino121333785
max daily deaths 1M 7d MA2020-03-22San Marino6333785
population > 100000,
max cumulative cases 1M
2020-05-22Qatar138942781677
population > 100000,
max cumulative deaths 1M
2020-05-22Belgium80411422068
population > 100000,
max daily deaths 1M 7d MA
2020-04-17Belgium2911422068
population > 100000,
max daily deaths 1M
2020-04-26Ireland484853506
recent cases max2020-05-22United States of America25434327167434
recent deaths max2020-05-22United States of America1263327167434
recent cases max 1M2020-05-22Qatar5582781677
recent deaths max 1M2020-05-22Brazil5209469333
worldldwide Covid1-19 cases2020-05-2250670877550105433
worldldwide Covid1-19 deaths2020-05-223327047550105433
  1. USA leads in absolute numbers, it has big population but China one is even bigger and pandemic started there. China either quenched Covid-19 or implemented creative reporting, the former is easier.
  2. In San Marino nobody died due to Covid-19 since 27th April and they report cases on daily basis. There is a good chance the virus penetrated entire population, killed 0.12%, This hardly qualifies as carnage.
  3. Daily deaths maximum straight number (Ireland) and moving average (Belgium) were scored back in April
  4. Absolute number of deaths is impressive but it represents around 1% of all deaths on Earth in Feb – mid May time frame. Human population is huge, we are mortal, 7.5 billion population produces in average over 200 thousands deaths per day.

Top countries

Figures below show top 30 countries selected by cumulative number of cases. The group represents 90% of total cases and 95% of total deaths. In top 30 group lowest cumulative cases figure is 24.3 thousands cases.

  1. Countries are sorted by cumulative cases per 1 million people
  2. China (CN) is unique in its ability to stop Covid-19. No other country poor nor rich small nor big was able to repeat its success. China culture is not about social distancing. Is superb quarantine or rather creative reporting behind China success?
  1. Countries are sorted by cumulative deaths per 1 million people
  2. Again China is at the end. Normally country first hit by epidemic will suffer most, others can learn from its experience and prepare a better response. Maybe they are stubborn to learn and inept to implement solutions instantly developed in China?
  1. Countries are sorted by cases mortality
  2. Please note wide range of cases mortality rate, from 1% Russia to 20% France. This indicates wide difference in both death and case definition.

Covid-19 cases and deaths evolution

Figure below compare recent and reference values. We show Covid-19 cases and deaths. Countries are selected in the following way:

  1. Dashed lines represent reference countries, we are looking for historical maximum in the following categories:
    1. cumulative cases (cc),
    2. cumulative cases per 1 million people (cc_1M),
    3. cases per 1 million people 7 days moving average (cma_1M)
  2. Solid lines represent 3 countries with top recent cma_1M.
  3. Country once selected is excluded from subsequent selections.

Rule for deaths comparison is similar to cases one.

  1. Quatar reports significantly more cases per million people than any country, while its death toll is low (see earlier charts). We see historical maximum in cumulative cases per million and cases per million moving average now, so Quatar line is dashed. This can be explained either by superb testing coverage or long lag between infection (case) and death. Please note cases surge took place in April. Lock down measures did not help to prevent it.
  2. Singapore (SG) is no longer among top cases countries.
  3. South America and Persian Gulf is Covid-19 are hot spots, again lock down does not prevent Covid-19 spread.
  1. Deaths per 1 million people are dropping
  2. Brazil replaced Italy and its deaths per million are on rise.
  3. Contrary to some media claims there is no surge in Sweden deaths.

Cases mortality comparison

We calculate cases mortality dividing cumulative deaths by cumulative cases. High and low cases mortality countries are selected in the following way:

  1. More than 20 cumulative deaths and 10000 cumulative cases
  2. Sort by cases mortality rate
  3. Take top 5 and bottom 5 from above list
  4. Add Germany to result
  1. Top mortality countries is stable, so is low group
  2. Mortality rate in UK drops, this may be due to increased testing capacity or Covid-19 true cases peak – everybody prone to virus already infected.

Chart below shows countries with lowest mortality rate.

  1. Russia has very high number of cases, above 300 thousands, this is order of magnitude higher than other countries on chart. Interesting is mortality rate for Russia stays constant. For other countries it went up once number of cases soared.
  2. Singapore has around 30 thousands cases and very low mortality rate, total deaths as of 12.05 are 23.

Cumulative deaths per 1 million people

  1. Leaders group is constant

Covidmeter

Covidmeter compares cumulative deaths per million people for top countries with reference. Reference countries are:

  1. Diamond Princess cruise ship
  2. San Marino – country, enclave in Italy

DP development is closed, crew and passengers disembarked the ship. San Marino is a live group, the country has tiny population, over 30 thousands, but it was hard hit my Covid-19.

  1. No country came close to Diamond Princess death toll declared limit at the beginning of April
  2. San Marino still reports Covid-19 cases on daily basis, last death was reported 27th April. Neither Covid-19 nor common cold will be fully eliminated there.

Covidmeter 14.05

Mid May Covidmeter findings:

  1. Lock down does not prevent Covid-19 spread
  2. China reporting standards are different than other countries. You can call it cheating if you like. It is just a tag, however Chinese propaganda will not like it
  3. Covid-19 deaths toll scary in absolute numbers pales compared with population size
  4. Both common cold and Covid-19 are here to stay, they will not take us all from here to eternity, just some individuals

World summary

Table below shows key numbers on Covid-19 development. ECDC data sets provide information on cases and deaths, so we can find some top scores. Metric come in some variations, they can be combined:

  1. Suffix 1M – per 1 million inhabitants data.
  2. Suffix 7d MA – 7 days moving average
  3. Prefix population > – values calculated for countries above population threshold.
datecountryvaluepopulation
max cumulative cases2020-05-14United States of America1390746327167434
max cumulative deaths2020-05-14United States of America84133327167434
max cumulative cases 1M2020-05-14San Marino1903233785
max cumulative deaths 1M2020-04-27San Marino121333785
max daily deaths 1M 7d MA2020-03-22San Marino6333785
population > 100000,
max cumulative cases 1M
2020-05-14Qatar95402781677
population > 100000,
max cumulative deaths 1M
2020-05-14Belgium77411422068
population > 100000,
max daily deaths 1M 7d MA
2020-04-17Belgium2911422068
population > 100000,
max daily deaths 1M
2020-04-26Ireland484853506
worldldwide Covid1-19 cases2020-05-1443095087547997301
worldldwide Covid1-19 deaths2020-05-142986737547997301
  1. USA leads in absolute numbers, it has big population but China one is even bigger and pandemic started there. China either quenched Covid-19 or implemented creative reporting, the former is easier.
  2. In San Marino nobody died due to Covid-19 since 27th April and they report cases on daily basis. There is a good chance the virus penetrated entire population, killed 0.12%, This hardly qualifies as carnage.
  3. Daily deaths maximum straight number (Ireland) and moving average (Belgium) were scored back in April
  4. Absolute number of deaths is impressive but it represents around 1% of all deaths on Earth in Feb – mid May time frame. Human population is huge, we are mortal, 7.5 billion population produces in average over 200 thousands deaths per day.

Top countries

Figures below show top 30 countries selected by cumulative number of cases. The group represents 90% of total cases and 95% of total deaths.

  1. Countries are sorted by cumulative cases per 1 million people
  2. China (CN) is unique in its ability to stop Covid-19. No other country poor nor rich small nor big was able to repeat its success. China culture is not about social distancing. Is superb quarantine or rather creative reporting behind China success?
  1. Countries are sorted by cumulative deaths per 1 million people
  2. Again China is at the end. Normally country first hit by epidemic will suffer most, others can learn from its experience and prepare a better response. Maybe they are stubborn to learn and inept to implement solutions instantly developed in China?
  1. Countries are sorted by cases mortality
  2. Please note wide range of cases mortality rate, from 1% Russia to 20% France. This indicates wide difference in both death and case definition.

Covid-19 cases and deaths evolution

Figure below compare recent and reference values. We show Covid-19 cases and deaths. Countries are selected in the following way:

  1. Dashed lines represent reference countries, we are looking for historical maximum in the following categories:
    1. cumulative cases (cc),
    2. cumulative cases per 1 million people (cc_1M),
    3. cases per 1 million people 7 days moving average (cma_1M)
  2. Solid lines represent 3 countries with top recent cma_1M.
  3. Country once selected is excluded from subsequent selections.

Rule for death comparison is similar to cases one.

  1. Quatar reports 4 times more cases per million people than next country in this category, while its death toll is low (see earlier charts). We see historical maximum in cumulative cases per million and cases per million moving average now, so Quatar line is dashed. This can be explained either by superb testing coverage or long lag between infection (case) and death. Please note cases surge took place in April. Lock down measures did not help to prevent it.
  2. Singapore (SG) was in lock down, observed social distancing, is geographically isolated, has strong somewhat authoritarian government. Yet it experienced Covid-19 outbreak in April. It seems no one but China can implement lock down properly.
  3. Quatar, Bahrain and Kuwait are top 3 in recently detected cases. Persian Gulf is Covid-19 hot spot, again lock down does not prevent Covid-19 spread.
  1. Deaths per 1 million people are dropping
  2. In Italy we see a jump of daily deaths. Covid-19 takes long time to incubate and produce fatality, so it may be not directly related to lock down easing. Increased figure is still low comparing to historical values.

Cases mortality comparison

We calculate cases mortality dividing cumulative deaths by cumulative cases. High and low cases mortality countries are selected in the following way:

  1. More than 20 cumulative deaths and 10000 cumulative cases
  2. Sort by cases mortality rate
  3. Take top 5 and bottom 5 from above list
  4. Add Germany to result
  1. Top mortality countries is stable
  2. Mortality rate in UK drops, this may be due to increased testing capacity or Covid-19 true cases peak – everybody prone to virus already infected.

Chart below shows countries with lowest mortality rate.

  1. Russia has very high number of cases, above 110 thousands, this is order of magnitude higher than other countries on chart. Interesting is mortality rate for Russia stays constant. For other countries it went up once number of cases soared.
  2. SIngapore has over 20 thousands cases and very low mortality rate, total deaths as of 14.05 are 21.

Cumulative deaths per 1 million people

  1. Leaders group is constant
  2. Italy shows increase, too early to declare it a trend

Covidmeter

Covidmeter compares cumulative deaths per million people for top countries with reference. Reference countries are:

  1. Diamond Princess cruise ship
  2. San Marino – country, enclave in Italy

DP development is closed, crew and passengers disembarked the ship. San Marino is a live group, the country has tiny population, over 30 thousands, but it was hard hit my Covid-19.

  1. No country came close to Diamond Princess death toll declared limit at the beginning of April
  2. San Marino still reports Covid-19 cases on daily basis, last death was reported 27th April. Neither Covid-19 nor common cold will be fully eliminated there.

Covid19 collateral damage

Collateral damage comes from military, it means unintended death or injury resulting from military operations. There is a good chance Covid19 pandemic fight results in deaths of people not infected with the virus itself, so it has collateral damage.

Inflated death count

Belgium reported recently a substantial number of Covid19 deaths, it made it the world leader in mortality per million of people. There were comments in local media suggesting all deaths in nursery houses for old people were qualified as Covid19 related, without confirming actual virus presence in deceased. Indeed on official page info-coronavirus.be you can find information like the one above dated 17.04:

Of the 5 163 people who died, 44% died in hospital, 54% in a rest and care home, 0.6% at home and 0.2% in another location. The deaths in hospital are all confirmed cases. Deaths in rest homes are either confirmed cases (7.8%) or suspected cases (92%)

Source

Population mortality impact

Since half of deaths contributed to Covid19 are just suspected, there is clearly a bias to attribute all deaths to the virus, inflate its toll. On the same site you can find information on total mortality in Belgium, chart copied from the article is displayed below.

Source: Analysis on the excess mortality due to Covid-19

There is a clearly visible surge of daily deaths, from mid March to mid April, we can read the following numbers:

  • Total deaths 300 to 600 (solid orange)
  • Covid19 confirmed 0 to 100 (dashed green)
  • Covid19 confirmed and suspected 0 to 300 (solid green)
  • Covid19 suspected 0 to 200 – difference between Covid19 total and suspected – area between solid and dashed green

Covid19 collateral damage – suspected deaths

Covid19 suspected deaths are those from care (nursery) homes, who passed away and had no positive Covid19 test. It is not clear if medical authorities plan to confirm virus presence in post-mortem. We can presume suspected and confirmed deaths alike are reported as Covid19 deaths. This is a flaw, suspected deaths should be verified, there may not result from the virus directly. They may be just collateral damage resulting from:

  1. Elevated stress level. Media stories about Covid19 mortality, especially among older people clearly make people anxious and raise stress level. Extraordinary lock down measures taken by government don’t make people tranquil. Permanent stress is hazardous, it deteriorates health and may result in premature death.
  2. Medical resources focused on epidemic response reduce care level for patients with chronic disease. This does not result from bad faith, just shortage of resources and allocation inefficiencies.

Death from virus and collateral damage separation

In order to understand epidemic impact It is important to report death causes correctly. We have a combination of virus epidemic and fear epidemic. Inflating deaths related to the former does not make curbing the latter easier. Belgium decision to report suspected cases had big impact on reported numbers:

Of the 7 094 people who died, 45% died in hospital, 53% in a rest and care home, 0% at home and 0% elsewhere. The hospital deaths are all confirmed cases. The deaths in rest homes are both confirmed (10%) and suspected (90%) cases.

Source 26.04 report

7094 * 0.53% * 0.9 = 3384, almost 48% of total deaths are suspected ones. This introduces a huge margin of error to collected data. Some suspected cases are direct Civid19 victims, others are collateral damage, proportion remains unknown.

Medical resources allocation issues examples

  • Hungary decided to empty hospitals. In early April the Hungary government ordered hospitals to ensure that over 30,000 are available for Covid19 patients, the number was then increased to 40000. Hungary has recorded 250 deaths from the Covid19 as of 24.04, and has 2,383 known cases. This had an impact on existing patients who were forced home.
  • Italian province Lombardy hard hit my Covid19 had many hospital beds available, but was short on family doctors and general practitioners. Patients who should have been recovering at home were taken to hospital, putting undue stress on capacity. Doctors making house visits were not adequately protected. Some died and others may have inadvertently spread the virus. Details here.

Final advice

Stay calm and breath normally. Excessive fear of Covid19 can kill you faster than the virus. Virus can sneak in, decision to join collateral damage ranks is on you.

Covid19 – Naive truth and true lies in China

I generally consider Reuters a valuable source of information. However a combination of 2 recent articles about Covid19 in China reveals Reuters interpretation of data is somehow naive. Data analysis led me to some China conspiracy hypothesis outlined at the end of this post, but let us see source data first:

April 23 Three negatives and a positive: problems with coronavirus tests in China

  • Trader He Ximing from Wuhan caught the coronavirus
  • X-rays showed his lungs had white blotches, similar to those found in coronavirus patients, but his nucleic acid test was not positive so a hospital declined to admit him.
  • As a precaution, a committee that manages his housing compound put him in quarantine for 14 days.
  • on March 28, he took a fourth nucleic acid test, which was again negative, but he was also tested for antibodies and got confirmation
  • A survey by Chinese doctors in February looking at samples from 213 patients suggested a false-negative rate of about 30%.

Antibodies presence typically means one was infected and build resilience to the virus. Infection may be symptoms free. Article focuses on individual calamity of trader, but ignores meaning of numbers.

April 22: Recovered, almost: China’s early patients unable to shed coronavirus

  • As of April 21, 93% of 82,788 people with the virus in China had recovered and been discharged, official figures show.
  • Some patients are confined to test centers for at least 28 days and obtain two negative results before being allowed to leave.

Data analysis

Let us combine information from 2 articles listed above. If Covid19 test has false negative rate of 30% it means probability of passing 2 consecutive tests is:

0.3 * 0.3 = 0.09 or 9%

Since 93% of 82,788 infected people had been discharged we can estimate number of false negatives among them:

0.93 * 82788 * 0.09 = 6929

In plain words if Reuters numbers are true there have been close to 7 thousands people infected with Covid19 and showing no symptoms, released to the society. This should have caught editors’ attention if they still bother to employ one. Simple coin toss will produce 50% false negatives, so 30% is a huge number. In order to go below 1% false negatives, you need to run 4 consecutive tests if a single test false negative rate is 30%. Even 1% false negatives will result in around 700 infected patients release.

Now if Chinese authorities claim they have save general public from Covid19 by applying strict quarantine measures and isolating all cases, above numbers make the claim suspicious. Release of 7000 contagion sources to population without immunity would result in immediate surge of new cases. Let’s have a look at China cases reported since March:

We see daily cases trend toward 0 indicating no surge of new cases whatsoever. This can be explained in the following way:

  1. General population build resilience to Covid19. This may not be the case at whole country level yet, but places which went over epidemic, like Wuhan, now have immune population. False negatives can be released with no substantial risk.
  2. China understood from statistical data on Wuhan outbreak, Covid19 is initially deadly to a small fraction of population. Since vast majority of cases are either symptom free or mild population immunity builds quickly. Thus Covid19 is contagious, dangerous for individuals but innocuous for overall population.
  3. Social distancing and quarantine help to manage outbreak, but are not essential to curb epidemic.

Assuming above is true why is China not willing to share the knowledge? Perhaps they see it as an opportunity to build economical advantage over other countries. EU and US economies under lock down are taking a heavy toll. They will likely slump into depression if Covid19 measures are not lifted fast. Why EU does not care to verify if Chinese scenario outlined above is true? We have plenty of data at our disposal to do it.

Covidmeter – Covid19 in numbers and facts – 23.04 update

Charts and tables updated with 23.04 data. Please go here for missing definitions. Key findings:

  • Belgium probably over reported Covid19 deaths
  • New cases at Singapore are surging, mortality is still low
  • No unified definition of Covid19 inflicted death obstructs country data comparison
  • Country lock down does not compensate high population density

Deaths per 1 million population

  • Calculate daily deaths per 1 million people (deaths_1M) defined as:
    (deaths in country on given day) / (country population size) * (1 million)
  • Take all countries from ECDC data set with more than 10 cumulative Covid-19 deaths and more than 100 detected cases, sort descending by deaths_1M
  • Take top 10 countries from above list and plot results

Isle of Man joined top group, it has population of 80 thousands, 15 deaths

No changes in above one million population countries group

Cases per 1 million population

Ranking created like the one for deaths:

  • Calculate daily cases per 1 million people (cases_1M) defined as:
    (new cases in country on given day) / (country population size) * (1 million)
  • Take all countries from ECDC data set with more than 10 cumulative Covid-19 deaths and more than 100 detected cases, sort descending by cases_1M
  • Take top 10 countries from above list and plot results

Please note Luxembourg is 3rd in all countries ranking, it has around 600 thousands inhabitants. It seems to be well after infections peak.

Singapore cases are growing rapidly, death count is still tiny. We’ll keep an eye on it.

High and low cases mortality countries

  • More than 20 cumulative deaths and 10000 cumulative cases
  • Sort by cases mortality rate
  • Take top 5 and bottom 5 from above list
  • Add Germany to result

Sweden replaced Netherlands in top 5. Saudi Arabia joined bottom 5 (exceeded 20 deaths threshold)

As of 2020-04-23 there were 29 countries meeting 100 cumulative deaths and 10000 cumulative cases threshold. They are listed in table below sorted by cases mortality rate top down. Poland is among new countries in the group.

Countrypop2018CumCasesCumDeathsCumDeaths_1MCasesMortality
France6698724411915121340318.617.91
Belgium11422068418896262548.214.95
United Kingdom6648899113349518100272.213.56
Italy6043128318732725085415.113.39
Sweden10183175160041937190.212.10
Netherlands17231017348424054235.311.64
Spain4672374920838921717464.810.42
Mexico126190788105449707.79.20
Iran, Islamic Republic of8180026985996539165.96.27
Brazil20946933345757290613.96.35
United States of America32716743484262946784143.05.55
China13927300008387646363.35.53
Ecuador170843571085053731.44.95
Canada3705885640179197453.34.91
Ireland485350616671769158.44.61
Switzerland8516543281861216142.84.31
Poland379785481016942611.24.19
Portugal102817622198278576.33.57
Germany82927922148046509461.43.44
India1352617328213936810.53.18
Austria88470371492449455.83.31
Peru319892561925053016.62.75
Japan126529100117722872.32.44
Turkey8231972498674237628.92.41
Korea, Republic of51635256107022404.62.24
Chile18729160112961608.51.42
Israel88838001459219121.51.31
Saudi Arabia33699947127721143.40.89
Russian Federation144478050579995133.60.88

Country insight

Change in layout of this section we compare countries selected after lock down measures severity. Numbers on list below reflect country ranking

  1. Belgium – moderate: business shutdown, sport activities outside allowed. Population density 376/km2
  2. France – severe: business shutdown, stay at home order so no sports outside. Population density 104/km2
  3. Sweden – relaxed: Keep social distance but some public places remain open. Population density 23/km2

It seems Covid19 impact grows with population density. In my opinion lock down measures efficiency is limited in densely populated areas.

Daily deaths

Belgium ranking can be overstated. There were comments Belgium reported all deaths in nursery houses for eledery people as Covid19 caused without actual virus presence test. This practice has been probably abolish recently. We’ll try to investigate it further. Please note there is no unified definition of Covid19 victim, so deaths reported in countries may adopt different criteria. Unfortunately there is no information on total daily deaths in ECDC data set.

Daily cases

I do hope France under reports cases, otherwise 18% cases mortality looks scary.

Cumulative cases and deaths

Newcomer – Poland

Poland matches standard pattern: Low testing capacity focuses on more severe cases with higher death probability. In result cases mortality goes up.

Population mortality

  • Calculate cumulative deaths per 1 million people (cumdeaths_1M) defined as:
    (total deaths in country till given date) / (country population size) * 1 million
  • Take countries with population above 1 million
  • Sort by cumdeaths_1M descending
  • Select top 5 from above list

Belgium qualified all deceased in nursery houses as Covid19 victims without testing for actual virus presence. The line should be revised down probably.

Covidmeter

San Marino reference line uptick due to additional death. Please remember population is tiny, every deaths is visible. Lack of common definition of Covid19 fatality can easily obscure this ranking.

Covidmeter upgrade reveals Belgium as the leader

Growing Covid-19 pandemic hit many countries, its severity is typically measured by number of detected cases and death toll. Since countries differ in population size, we have to take it into account while estimating true impact. Original Covidmeter used total (cumulative) deaths per 1000 people to estimate population impact. We can calculate similar ratio for daily deaths to build a faster indicator. Since numerator is lower we calculate daily deaths per million people. Let’s see what upgraded Covidmeter shows.

Continue reading